The Small Cap Swing Trader Alert Archive
Below you'll find The Small Cap Swing Trader setups stacked up and ordered chronologically.Positive Mindset in Trading: What Performance Psychology Reveals About Staying Resilient and Profitable
Weight Loss Drug Market
The Weight Loss Drug Market: Chaos, Consolidation, and Trading Opportunities
The weight loss drug market is undergoing another shake-up. Compounded GLP-1 versions are gone, direct-to-consumer pricing is here, and telehealth partnerships are unraveling.
For traders, that means volatility in Novo Nordisk, Eli Lilly, and telehealth stocks like Hims & Hers.
From shortages to shutdown
For more than a year, compounding pharmacies filled the gap when branded Wegovy (Novo) and Zepbound (Lilly) couldn’t meet demand.
Knockoff semaglutide versions sold for $200–300/month, far below Wegovy’s $1,350 list price. By early 2025, more than 1 million patients were on compounded drugs.
That ended May 22, when the FDA declared shortages over and barred large-scale compounding. Patients lost access overnight.
What’s next for patients?
- Cash-pay options: Novo and Lilly now sell branded drugs direct-to-consumer for ~$499/month. Novo even offered a $199 promo month.
- Telehealth tie-ins: Firms like Ro, LifeMD, and Teladoc have struck deals to distribute discounted branded versions.
- Breakdown risk: Novo’s partnership with Hims collapsed this week, wiping 30% off Hims’ stock in one session.
Lingering gray areas
Some telehealth providers still advertise compounded semaglutide at $165/month under the “personalized prescription” loophole.
Novo accuses them of hiding behind “false guise” to keep competing with Wegovy. The FDA has yet to draw a clear enforcement line.
Winners and losers
- Eli Lilly (LLY): Prescription data shows Zepbound sales +24% QoQ. Analysts view Lilly as the long-term winner.
- Novo Nordisk (NVO): Wegovy growth is slower (+5–6% QoQ). Partnership disputes add headline risk.
- Hims & Hers (HIMS): Shares collapsed on Novo split. Remains a volatile day-trading vehicle.
- Telehealth sector: Partnerships with Lilly may provide stability, but regulatory risk is high.
Trading setups
| Ticker | Bias | Key Level | Setup |
|---|---|---|---|
| LLY | Bullish | $690.50 support | Buy dips for swing into $716.50–$739 on strong prescription trends. |
| NVO | Neutral / Watch | $57.05 resistance | Breakout above $57.05 targets $62.25; failure risks pullback to $47.50. |
| HIMS | Speculative Short-term | $52.00 – $59.00 | Gap fades possible. High-risk intraday scalp candidate. |
Bottom line
The weight loss drug market is still messy. Novo and Lilly are consolidating control, but telehealth players face turbulence.
For traders, that means focus on LLY for strength, NVO for breakout potential, and HIMS as a speculative volatility play.
Expect headlines to keep this group in motion for months to come.
TraderInsight Premium Trading Setup Guide: Black Friday Edition
Level Up Your Trading Gear for 2026
Black Friday is here — and for traders, it’s one of the best times of the year to upgrade your tools, tech, and trading environment.
Whether you’re just starting out or already running a multi-monitor command center, this weekend offers an opportunity to level up your hardware, sharpen your skills, and make sure your trading infrastructure supports your goals for the year ahead.
At TraderInsight, we’ve put together a three-tier guide to help you build or upgrade your ideal trading setup — from budget-friendly to professional-grade.
We’ve also included recommended books and accessories to round out your trading edge.
🟩 Tier 1: Entry-Level Trader Setup
Perfect for: New traders, mobile traders, and anyone upgrading from an everyday computer.
This tier focuses on reliability, mobility, and clean performance — enough power to run your brokerage platform, charting tools, scanners,
and research browsers without strain.
Recommended Hardware

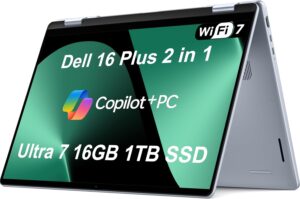
- Dell 16 Plus 2-in-1 Laptop
A superb hybrid device with plenty of power for charts and scanners, while remaining light enough for travel. - LG Gram 17″ Touchscreen
A lightweight machine with a large display, ideal for traders who need screen space without committing to a desktop.
Recommended Accessories


Recommended Books
- The Disciplined Trader — Mark Douglas
- Trading in the Zone — Mark Douglas
- Trading Journal — Adjust and Achieve Log Books
Why This Tier Works:
It’s affordable, fast, and flexible — excellent for first-hour trading strategies like Around the Horn, Opening Gap, and Volatility Bands.
🟦 Tier 2: Intermediate Trader Setup
Perfect for: Active traders, regular War Room participants, and Boot Camp alumni.
This tier supports more charts, more scans, and more multitasking — ideal for traders who run multiple platforms simultaneously.
Recommended Hardware
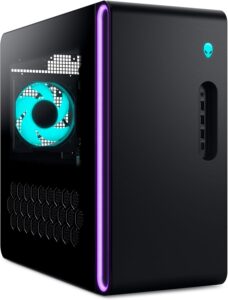
- Alienware Aurora ACT1250 Desktop
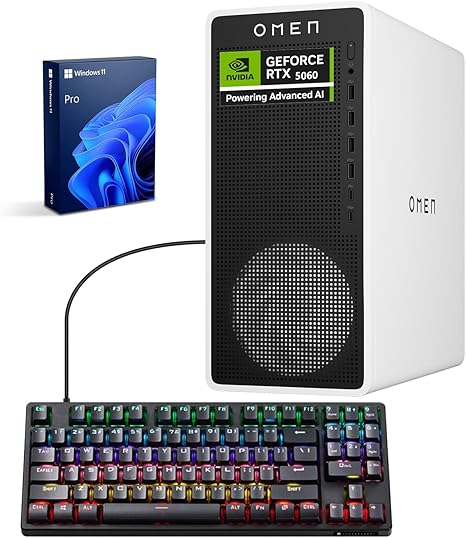
A trading powerhouse with excellent cooling and plenty of RAM and CPU strength. - HP Omen 35L Desktop
A strong performance-per-dollar machine that easily supports 3–4 monitor setups.
Recommended Monitor Layout
- Center: Execution platform (RealTick)
- Left: Scanners (XRV, Volatility, Gaps)
- Right: Bookmap / Options flow / News
Recommended Books

- Technical Analysis of Financial Markets — John J. Murphy
- Encyclopedia of Chart Patterns – Thomas Bulkowsky
Why This Tier Works:
Ideal for traders who want fast execution during the first hour and smooth performance during midday volatility.
🟥 Tier 3: Pro TraderInsight Trading Setup
Perfect for: Full-time traders, advanced War Room members, coaches, and those running multiple platforms, analysis tools, and heavy workloads.
This setup is designed for maximum reliability, zero latency, and the ability to run several platforms at once — RealTick, Bookmap, Thinkorswim, Python scripts, scanners, recording tools, and more.
Recommended Hardware
- Alienware Aurora R16 (i9 Processor)
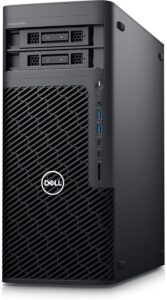
A top-tier trading rig with massive CPU power and room for as many monitors as your desk can hold. - Dell Precision 5860 Workstation
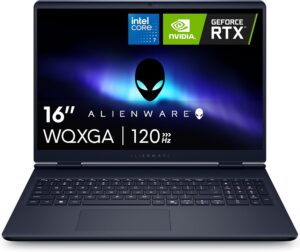
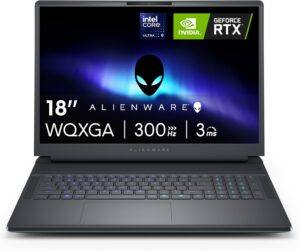
A professional-grade system, built for 24/7 stability, perfect for heavy analysis and multi-asset trading. - Alienware Area-51 18″ Laptop
A portable workstation that performs like a desktop — ideal for hotel setups, traveling, or event-based trading.
Professional Monitor Layout
- Top row: Market internals, volatility dashboards, futures
- Middle row: RealTick + primary symbols
- Side monitors: Bookmap, scanners, news feeds
Recommended Books:


- Market Wizards (series)
- Maximum Trading Gains with Anchored VWAP – Brian Shannon
- Around the Horn — Updated edition coming soon
Why This Tier Works:
Ultimate power, ultimate reliability — and no bottlenecks when markets are moving fast.
TraderInsight Black Friday Add-Ons
These items elevate any setup, regardless of tier.
Monitors
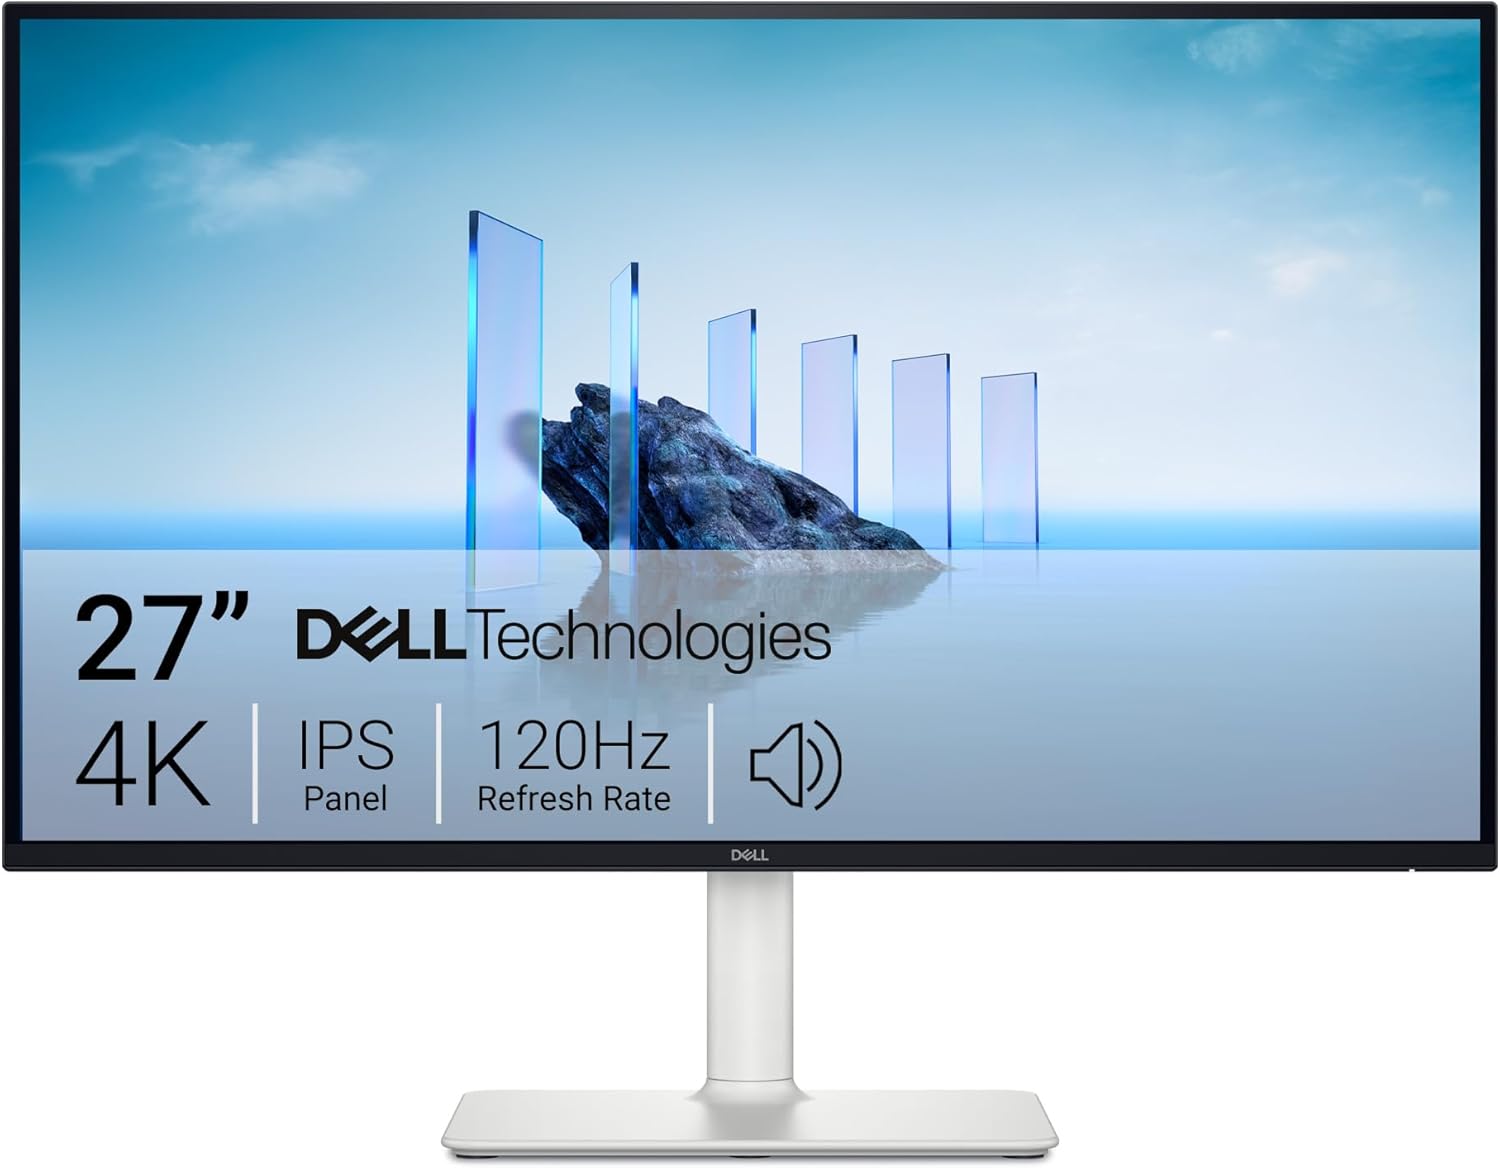
- Dell Ultrasharp 27″
- LG 34″ Ultrawide
- ASUS ProArt series
Peripherals


- Logitech MX Mechanical keyboard
- Stream Deck (custom hotkeys for executions)
- APC UPS battery backup
- Thunderbolt 4 docking station
Desk & Comfort
Final Thoughts
Whether you’re upgrading your laptop, expanding your monitor setup, or building a full-scale trading command center, Black Friday is the moment to get the most value for your investment.
Your trading tools should support your consistency, precision, and confidence — and this guide is designed to help you make smart, strategic upgrades that will serve you all year long.
If you’d like a personalized setup recommendation based on your trading style, just let us know — we’re happy to build a custom configuration.
Target Earnings Guidance Cut
Target Slashes Guidance Again as Sales Decline — A Turning Point for the Retail Giant?
Target reported another disappointing quarter, with sales falling for the fourth straight period, and management issued yet another earnings guidance cut. The retailer now faces a critical moment as incoming CEO Michael Fiddelke attempts to reverse a year-long downtrend that has left the stock 36% lower in 2025.
Sales Keep Falling Despite an Earnings Beat
Adjusted third-quarter earnings came in at $1.78 per share, beating expectations of $1.71. But that’s where the good news ends. Sales slipped 1.5% to $25.3 billion, and comparable sales fell 2.7%, marking the fourth consecutive quarter of negative comps.
Executives warned that macro headwinds—uncertainty over the government shutdown, softer labor markets, and inflation sensitivity—continue to weigh on shoppers’ willingness to buy discretionary goods.
The retailer’s latest Target earnings guidance cut lowers full-year EPS to $7–$8, down from $7–$9 previously. GAAP EPS was cut as well.
A New CEO, A Big Turnaround Attempt
Incoming CEO Michael Fiddelke takes command in February, but he is already moving aggressively. He outlined three pillars for the turnaround:
- Merchandising reinvention — strengthening authority in key categories
- Guest experience upgrades — cleaner stores, better digital integration
- Tech acceleration — including AI tools and smarter fulfillment
To support this, Target will boost capital expenditures by 25% in 2026, pushing annual capex to $5 billion. That includes store remodels, redesigns of fulfillment flows, and efforts to reduce the operational strain that online orders have placed on high-traffic stores.
Still, another Target earnings guidance cut underscores how difficult the road ahead may be.
Target Joins Walmart, Shopify, and Etsy in the AI Commerce Push
Target also announced a partnership with OpenAI, allowing shoppers to buy directly through ChatGPT. This places Target among early adopters of AI-powered commerce, following Walmart, Shopify, and Etsy.
The beta launch next week will let customers purchase multiple items, add fresh food to carts, and select fulfillment methods—all within ChatGPT. Fiddelke framed the initiative as part of a broader strategy to reassert Target’s innovation edge.
Bulls vs Bears: Both Camps Found Ammunition
Analysts were split following the report. JP Morgan’s Christopher Horvers said both sides “have something to point to.” Bears cite weakening demand, deteriorating comps, and the ongoing Target earnings guidance cut. Bulls point to improving inventory discipline, healthy margins, and extremely discounted valuation multiples.
Oppenheimer’s Rupesh Parikh maintained an Outperform rating, noting that long-term investors should take advantage of weakness—though volatility may persist until comps turn positive again.
Trading Implications for TGT
📉 Short-Term Bias: Weakness Into Q4
The market reacted negatively to the Target earnings guidance cut, pushing shares lower in early trading. For day traders, the following setups may emerge:
- ORB downside breaks under premarket lows
- Short VWAP rejections during the morning session
- Fade rallies into $130–$132 resistance zones
📈 Swing Traders: Watch for Capitulation
With the stock down 36% YTD and valuation compressed, TGT could become a mean-reversion candidate if:
- RSI reaches oversold levels
- Price stabilizes above major weekly support (~$118–$120)
- Consumer data surprises to the upside
But until comps turn positive, the Target earnings guidance cut will likely keep pressure on the stock.
Bottom Line
Target’s challenges are real: falling sales, cautious customers, and a tough retail landscape. The company’s transformation strategy—AI innovation, store upgrades, and fulfillment restructuring—could pay off, but the payoff won’t be immediate.
Traders should brace for continued volatility as the market digests the latest Target earnings guidance cut and evaluates whether 2026 will finally mark the beginning of a recovery.
Related:
Target (TGT) Q3 2025 earnings
Target CEO Change Overshadows Earnings Report – TraderInsight
Target Corporation Reports Third Quarter Earnings
Nvidia Earnings Smash Expectations
Nvidia Earnings Smash Expectations and Ignite AI Stocks Across the Board
Nvidia delivered another blockbuster quarter on Wednesday, easily beating Wall Street expectations and setting the stage for what traders are already calling a Nvidia earnings breakout heading into 2025. Shares surged in after-hours trading as the company once again proved that AI demand remains insatiable.

Blowout Numbers Across the Board
For the October quarter, Nvidia reported adjusted earnings of $1.30 per share, beating the $1.26 consensus. Revenue hit $57 billion, topping expectations for $54.9 billion. It was another monster quarter driven almost entirely by AI chips and data center demand.
Nvidia’s data center business — now the core of the company — grew 66% year over year to $51.2 billion, surpassing analyst models and reinforcing why the Nvidia earnings breakout narrative is dominating tech markets.
Guidance: Simply No Slowdown in Sight
Nvidia projected midpoint January-quarter revenue of $65 billion, well ahead of the $62.2 billion consensus.
Even more remarkable: CFO Colette Kress noted this guidance assumes zero revenue from China due to export restrictions. That means upside remains if any allowances or exceptions are granted in early 2025.
AI Demand Is Still “Sold Out”
CEO Jensen Huang made it clear that the AI boom is far from over. Blackwell GPU demand is overwhelming supply, and cloud providers continue to bid aggressively for any available compute capacity.
“Blackwell sales are off the charts, and cloud GPUs are sold out. We’ve entered a virtuous cycle of AI.”
— Jensen Huang, Nvidia CEO
With enterprises adopting AI far faster than expected, and agentic AI applications emerging as a new growth catalyst, the Nvidia earnings breakout trend is likely to extend into 2025 and beyond.
Addressing GPU Depreciation Concerns
Some analysts have questioned whether AI chips depreciate too quickly to justify massive data center spending. Nvidia pushed back hard: Kress emphasized that CUDA compatibility extends the life of GPUs far longer than typical hardware cycles.
“A100 GPUs we shipped six years ago are still running at full utilization today,” she said — another reason the Nvidia earnings breakout story remains intact.
Market Reaction and AI Stock Moves
Nvidia shares jumped 4.7% in after-hours trading. Other AI stocks followed:
- AMD initially traded higher before pulling back slightly
- Alphabet gained over 3%
- Palantir traded higher before retracing
Traders are now positioning for continuation setups across the AI sector, as the Nvidia earnings breakout provides macro-level confirmation that the AI cycle remains intact.
Trading Insights for NVDA and Related AI Names
📈 Nvidia (NVDA)
- Watch for an Opening Range Breakout above premarket highs
- Gap-and-go potential if volume accelerates during first 15 minutes
- Strong support zones: $178 → $182
📈 AMD (AMD)
- Likely to piggyback off Nvidia momentum
- Fades or reversals at key pivots ($226, $232) could offer intraday scalp setups
📈 Palantir (PLTR)
- Remains a high-beta AI sympathy play
- Look for VWAP reclaim trades on morning weakness
📈 Alphabet (GOOGL)
- Strong response to Nvidia’s results reinforces AI advertising & cloud thesis
- Breaks above $295 could trigger a multi-day continuation move
Bottom Line
This quarter wasn’t just another beat — it was confirmation that AI demand remains extraordinarily strong, GPU supply remains sold out, and hyperscalers are accelerating their infrastructure spending into 2025.
The Nvidia earnings breakout isn’t just about Nvidia — it’s a rising tide for the entire AI ecosystem.
For traders, today’s report offers a clear message: AI momentum trades remain alive, well, and tradable.
Related articles:
Nvidia AI Earnings Outlook Amid Market Volatility – TraderInsight
AI Chip Race: Who Will Dominate the Market? – TraderInsight
Google, Meta, and Microsoft Spend on AI – TraderInsight
Nvidia beat and raise should wow its critics, and the stock soars