The Small Cap Swing Trader Alert Archive
Below you'll find The Small Cap Swing Trader setups stacked up and ordered chronologically.How to Day Trade NVIDIA (NVDA)

NVIDIA Corporation (NVDA) has become one of the most popular stocks for day traders due to its liquidity, volatility, and position as a leader in the tech and semiconductor industries. With the rise in demand for GPUs, AI applications, and machine learning, NVDA’s stock movements are influenced by sector-specific developments and broader economic conditions, providing ample trading opportunities. Below are some insights and strategies on how to day trade NVIDIA (NVDA).
1. Understand NVDA’s Market Behavior and Influences
NVIDIA’s stock is impacted by a variety of factors, including:
Earnings Reports and Guidance: NVIDIA typically experiences price volatility around earnings releases. Watch for scheduled earnings announcements, often providing trading opportunities before and after the event.
Sector Trends and Tech News: NVDA is a leader in AI and semiconductor manufacturing. Positive or negative news about AI, data centers, gaming, and cryptocurrencies can cause sharp movements.
Market Sentiment and Economic Announcements: Given NVIDIA’s size and popularity, it is influenced by broader market sentiment, especially during announcements about interest rates, inflation, and employment data. Be mindful of economic reports that may impact the NASDAQ.
2. Key Technical Indicators for NVDA Day Trading
To maximize profitability, it’s essential to use technical indicators to help you accurately time entries and exits. Here are some effective tools for trading NVDA:
Moving Averages: Short-term moving averages, such as the 9-day or 21-day exponential moving averages (EMAs), are used to gauge momentum. When the price crosses above or below these EMAs, it often signals a trend reversal.
Relative Strength Index (RSI) can help identify overbought or oversold conditions. When NVDA’s RSI is above 70, it may be overbought; below 30, it could be oversold. Look for a reversal when the RSI enters these zones.
Volume and VWAP (Volume-Weighted Average Price): VWAP is crucial for identifying the average trading price over a specific period, weighted by volume. When NVDA trades above VWAP, it’s typically a bullish signal; when it’s below, it’s bearish. Additionally, increased volume often precedes significant price moves.
Support and Resistance Levels: Identify significant price levels where NVDA has historically reversed or consolidated. These levels act as psychological markers, often guiding the price’s next movement. It can signal a potential continuation if NVDA breaks a strong resistance level on high volume.
3. How to Day Trade NVIDIA (NVDA) – Proven Strategies
NVDA’s high volume and volatility make it suitable for various day trading strategies, including the following:
A. Opening Range Breakout (ORB)
The first 30 minutes after the market opens often sets the tone for NVDA’s intraday price action. This strategy involves identifying the high and low prices within the first 15–30 minutes and entering a trade when NVDA breaks above the high (for a long trade) or below the low (for a short trade).
Entry: Buy if NVDA breaks above the opening range high; sell short if it breaks below the opening range low.
Exit: Place a stop loss just below the breakout level (for long trades) or above (for short trades). Take profits gradually as NVDA moves in your favor.
B. VWAP Pullback Strategy
The VWAP pullback strategy is popular for trading highly liquid stocks like NVDA. When NVDA’s price pulls back to the VWAP after trending higher, it often allows one to enter the trend’s direction at a better price.
Entry: Enter a long trade if NVDA has been trending up and then pulls back to VWAP, or go short if it’s trending down and pulls back to VWAP.
Exit: Set a stop loss just below VWAP (for long trades) or above (for short trades) and look for profit targets at recent highs or lows, or even as it moves away from the VWAP.
C. Momentum Trading with RSI Divergence
NVIDIA’s stock frequently experiences momentum-driven moves, especially during high volatility sessions. This strategy involves using RSI divergence as a signal for reversals in high-momentum situations.
Entry: If NVDA’s price is making higher highs while the RSI is making lower highs (bearish divergence), consider shorting; if the price is making lower lows while the RSI is making higher lows (bullish divergence), consider going long.
Exit: Exit once the divergence is confirmed by a price reversal or a breakdown in the trend. For protection, place a stop loss near recent highs or lows.
4. Risk Management in NVDA Trading
A discussion of how to day trade NVIDIA (NVDA) needs to take account of NVDA’s potential for sharp moves. Robust risk management is crucial. Consider the following guidelines:
Position Sizing: Don’t risk more than 1-2% of your risk capital on any trade. Adjust your position size based on the distance to your stop loss.
Pre-Define Your Stop Loss: Before entering a trade, set a stop loss level where you will exit if the trade moves against you. Stick to this level to avoid excessive losses.
Set Profit Targets: Establish exit points based on technical levels or percentage gains. This prevents you from holding onto winning trades too long, which could lead to reversals and lost profits.
Avoid Over-Trading: High volatility stocks like NVDA can be exciting, but frequent trading increases transaction costs and can lead to impulsive decisions. Stick to your trading plan and avoid trades outside of your strategies.
5. Key Points to Remember When Day Trading NVDA
Stay Updated on News: NVDA is sensitive to industry news and economic reports. Set up alerts for earnings announcements, analyst upgrades or downgrades, and any significant news in the tech or semiconductor sectors.
Trade During High-Volume Hours: For NVDA, the best times to trade are usually within the first and last hours of the market session. Liquidity is higher, and the stock is more likely to exhibit strong trends.
Adapt to Market Conditions: NVDA can trade very differently in a bull versus a bear market. During a bullish trend, focus on buying breakouts and pullbacks. In a bearish trend, short opportunities may present themselves more often.
Final Thoughts on how to day trade NVIDIA (NVDA)
Day trading NVDA can be rewarding, but it requires preparation, discipline, and a clear understanding of technical analysis and risk management. By understanding NVDA’s market behavior, using proven strategies, and managing your risk, you can increase your chances of capturing profitable moves in this dynamic stock. Keep refining your approach, stay updated with market conditions, and always trade with a plan in place.
Good Trading,
Adrian Manz
Trading Range Expansions
Unlocking the Fast Ball Pattern: Trading Range Expansions Created by Institutional Momentum with Targeted Stop-Losses and Targets
When it comes to finding reliable trading setups, the Fast Ball pattern offers a unique opportunity to capitalize on momentum driven by institutional buying or selling. This powerful breakout pattern works by capturing expansion moves that occur after a period of consolidation or a pullback within a trend. Each version of the pattern—whether following a consolidation or a pullback—can reveal the influence of large market players entering or exiting positions with sizable order flow, and that’s where traders can align their trades for high-probability entries and exits.
What is the Fast Ball Pattern?
The Fast Ball pattern signals an opportunity when a stock that has recently consolidated or pulled back within a trend suddenly breaks out with an expansion of both price range and volume. This move is highly significant because it often indicates a large institutional player has made a decisive move, driving demand or supply and creating an imbalance that favors follow-through. Whether day trading or swing trading, the Fast Ball pattern allows traders to catch this momentum as it unfolds.
A consolidation breakout occurs after the stock has spent time moving sideways in a relatively narrow range, with little price movement. A pullback breakout, by contrast, happens after a temporary counter-trend move, where the stock dips or retraces slightly, setting up for a potential bounce. In either case, the breakout from consolidation or the reversal from a pullback represents a market moment where institutions, hedge funds, or other large entities are likely making sizable trades. This influx of capital creates visible price movement and often sustains the stock’s momentum, giving traders a chance to profit.

Market Dynamics at Play
The success of the Fast Ball pattern lies in its ability to pinpoint the moments when institutional forces take action. Institutions often build or unwind positions with careful attention to timing, attempting to execute orders without disrupting market stability. However, when their order flow is substantial enough to move price range and volume sharply, it creates a clear footprint on the daily chart. This expansion day suggests a genuine imbalance in supply and demand, revealing the direction large players are supporting.
When both range and volume spike, it’s more than a simple breakout. It reflects significant institutional interest, which signals to traders that there’s a strong chance for the momentum to continue in the breakout direction. A volume-backed range expansion suggests large capital flow is driving the trend, creating a higher probability of continued movement.
Trading the Fast Ball Pattern
The Fast Ball pattern can be traded with different approaches depending on your style, time frame, and risk tolerance. Here’s how day traders and swing traders can make the most of it:
- Entry and Stops:
- For day traders, the Fast Ball entry should be close to the initial breakout on the expansion day. Stops are best set using intraday support and resistance on that breakout day, allowing for quick entries and exits with a tighter risk profile.
- For swing and position traders, who may hold positions over multiple days, wider stops are suitable. These stops might be set at the low of the breakout day (for long trades) or at the high (for shorts), giving the trade more room to play out within the larger trend and to capture sustained momentum.
- Targets:
- Day traders can establish targets by looking at support and resistance zones on daily charts. These levels often act as near-term barriers, where order flow could potentially satisfy institutional buyers or sellers, leading the expansion move to pause or reverse.
- Swing and position traders may turn to weekly charts to identify broader support and resistance zones. These zones serve as key levels where momentum will likely meet institutional or high-volume order flow, which can end the breakout move. Setting targets at these longer-term levels allows for a bigger profit window but requires patience for the trade to unfold.
- Support and Resistance Levels:
- In both approaches, identifying support or resistance levels where price might encounter opposing order flow is essential. These levels can often act as magnets, drawing price until enough orders are filled to satisfy institutional buying or selling needs. Once these levels are met, the expansion move often slows or reverses, which makes them ideal exit points for traders using this pattern.
Why the Fast Ball Pattern Works
The Fast Ball pattern works because it captures the influence of large players in the market, aligning with their order flow at critical moments. When a stock breaks out of consolidation or a pullback, driven by a notable increase in volume and range, it’s a sign that demand or supply has shifted significantly—typically due to institutional trading. Unlike breakouts driven purely by speculative retail activity, those backed by institutional capital tend to be more reliable, as institutions have both the capital and conviction to see their trades through, which helps sustain the move.
By following the Fast Ball pattern, traders can catch a ride on this institutional momentum, entering at a moment when the setup reveals commitment from large players. While many setups rely on hoping for continued price movement, the Fast Ball is rooted in the dynamics of supply and demand imbalance, offering a high-probability trade entry that is less likely to fizzle out.
Final Thoughts
The Fast Ball pattern offers a roadmap for traders looking to trade with confidence. By focusing on consolidation and pullback breakouts that show clear signs of institutional participation, the setup aligns traders with larger market forces, rather than leaving them vulnerable to random price movement. With disciplined stops and well-chosen targets, day traders can capture quick profits within the day, while swing traders can take advantage of broader market moves by using weekly support and resistance to establish their exit points.
Ultimately, the Fast Ball pattern is about recognizing the signals left by big players in the market and leveraging those signals for gains. By aligning with institutional order flow, traders increase the likelihood of profitable trades and place themselves in sync with market momentum, allowing them to profit from moves that are backed by significant capital. This makes the Fast Ball pattern a cornerstone for any trader looking to make the most of the market’s dynamic forces.
Good Trading,
Adrian Manz
P.S. Join me at the Metastock Traders Conference this week. Click here to register.
The Risks Gamblers Face When Day Trading or Investing in Stocks
A gambling mindset in day trading investing can lead to a downward spiral. Like traditional gambling, day trading offers the allure of fast profits and quick wins, which can become addictive. Without the right mindset and approach, traders and investors who think like gamblers can quickly find themselves in serious trouble. Here, we’ll dive into some of the common issues gamblers face when they enter the stock market and why developing a disciplined, strategy-oriented mindset is essential for success.

1. Impulsive Decision-Making
One of the most significant problems gamblers face is impulsive decision-making. In gambling, a win or loss often comes down to luck, and decisions are often based on gut feelings or hunches. This impulsive approach can be catastrophic in the stock market. Effective trading and investing require research, planning, and a deep understanding of market trends and economic indicators. Relying on intuition or “hot tips” rather than solid analysis leads to risky trades and often substantial losses.
2. Ignoring Risk Management
Gamblers are often focused on the potential reward rather than the possible loss. This mindset leads to a lack of risk management—betting large sums on single trades, neglecting stop-loss orders, and failing to diversify. Without risk management strategies, a single bad trade can wipe out a significant portion of one’s portfolio. Successful traders know that protecting capital is crucial, and they treat risk management as a central part of their strategy, whereas gamblers are often willing to put it all on the line.
3. Chasing Losses
In gambling, there’s a phenomenon known as “chasing losses,” where individuals increase their bets to recoup their previous losses. When gamblers day trade, this same mindset can lead to revenge trading, where they overtrade or take increasingly risky positions to recover lost funds. This approach often leads to mounting losses as emotional decisions replace rational analysis. Successful traders understand that losses are part of the process and instead focus on maintaining consistency and learning from each mistake.
4. Addiction to the Thrill
For many gamblers, the excitement of placing a bet and watching it play out is a significant part of the appeal. With its fast pace and constant movement, day trading can mimic this thrill. However, trading based on excitement rather than calculated decision-making is a quick path to failure. This addiction to the rush of quick gains and losses can lead to a focus on high-risk trades with little regard for long-term success. Experienced traders know that while the stock market can be thrilling, successful trading is about strategy, patience, and discipline rather than excitement.
5. Neglecting Education and Research
A common problem among gamblers is the lack of interest in understanding the odds and probabilities. Similarly, gamblers who turn to day trading or investing often neglect the importance of continuous education and research. They may jump into trades without understanding technical analysis, fundamental analysis, or market trends. The stock market is complex, and without a solid understanding of how it works, even the most enthusiastic trader will likely lose money.
6. Overconfidence and the Illusion of Control
Gamblers often believe they have a certain level of control over random outcomes, which leads to overconfidence. In the stock market, this mindset can manifest as believing in one’s ability to “beat the market” consistently without the necessary tools, strategy, or experience. Overconfidence can lead to reckless decisions, over-leveraging, and excessive risk-taking. Skilled traders understand the importance of respecting the market, acknowledging its volatility, and working with a carefully considered plan.
7. Focusing on Short-Term Gains Over Long-Term Success
Gamblers typically focus on short-term gains, looking for quick wins and immediate returns. This approach doesn’t translate well to the stock market, where sustainable wealth is often built over time. Successful traders and investors understand the value of a long-term perspective, even if they engage in short-term trades. They are disciplined about sticking to their strategies and goals, whereas gamblers are more likely to jump from one high-risk trade to the next, hoping to “get rich quick.”
8. Emotional Trading
Finally, gambling is inherently emotional, and gamblers who trade often bring these emotions into the stock market. Fear, greed, frustration, and excitement can cloud judgment and lead to poor decision-making. Emotional trading, such as panic-selling during a market downturn or holding onto a losing position out of hope, often results in unnecessary losses. Savvy traders work to keep emotions in check and rely on analysis, not feelings, to drive their decisions.
The Path to Success: Trading with a Non-Gambling Mindset
For gamblers looking to succeed in the stock market, a major shift in mindset is essential. Here are some tips for developing a disciplined approach to trading and investing:
- Educate Yourself: Learn about technical and fundamental analysis, market trends, and economic indicators. Knowledge is a trader’s most powerful tool.
- Develop a Trading Plan: Set clear, achievable goals and establish a plan that includes specific entry and exit points, risk management strategies, and limits on how much you’re willing to lose.
- Prioritize Risk Management: Use stop-loss orders, avoid over-leveraging, and diversify your portfolio to protect against significant losses.
- Control Your Emotions: Avoid making trades based on feelings or impulses. Stick to your strategy and remember that successful trading is about consistent gains over time.
- Focus on Long-Term Success: Rather than looking for quick wins, aim to build a sustainable approach that will serve you well in the long run.
- Reflect on Losses: Instead of chasing losses, view them as learning opportunities. Analyze what went wrong and adjust your strategy accordingly.
The stock market offers a world of opportunity, but only for those willing to approach it with the right mindset. By trading with a disciplined, strategy-oriented approach and resisting the impulses that characterize gambling, traders can set themselves up for consistent, long-term success.
Good Trading,
Adrian Manz
November 8, 2024

How November’s Unemployment Numbers Could Impact the Stock Market
On November 8, 2024, the Department of Labor will release updated U.S. unemployment figures—a key economic indicator that could shape the stock market’s near-term direction. While unemployment data is traditionally viewed as a lagging indicator, it offers valuable insights into the labor market’s health, influencing consumer spending trends, broader economic expectations, and Federal Reserve policy decisions. Here’s what investors and market participants might anticipate as the numbers emerge.

Why Unemployment Matters to the Stock Market
Unemployment numbers reflect the state of the labor market, one of the primary drivers of consumer confidence and spending. Higher employment levels generally boost consumer spending, which constitutes around 70% of the U.S. GDP. Conversely, rising unemployment can signal a slowdown in consumer demand, affecting corporate profits, especially in retail, hospitality, and manufacturing sectors that rely heavily on consumer spending.
The unemployment report provides critical data for the Federal Reserve, which considers employment levels when setting monetary policy. If unemployment rises, it could prompt the Fed to consider loosening monetary policy to stimulate growth; if it falls, the Fed may see it as a green light to maintain or even tighten current policy levels.
Possible Scenarios and Market Reactions
Scenario 1: Lower-than-Expected Unemployment
If the unemployment rate comes in lower than expected, it would suggest a stronger labor market. While this is generally positive for the economy, a low unemployment rate could increase inflationary pressures, especially if wage growth accelerates. Investors may interpret this as a signal that the Federal Reserve will continue or intensify its efforts to keep inflation in check by holding interest rates steady or considering further rate hikes.
For the stock market, particularly rate-sensitive sectors like technology and real estate, such a scenario might dampen sentiment, as higher interest rates can reduce the present value of future earnings, causing valuations to decline. Conversely, sectors that benefit from higher rates, such as financials, might see a boost in stock prices.
Scenario 2: Higher-than-Expected Unemployment
If unemployment rises more than anticipated, markets might interpret this as a sign that economic growth is slowing, perhaps too quickly. While rising unemployment is a concerning sign for consumer spending, it could also signal that inflationary pressures are easing, which might prompt the Federal Reserve to consider pausing or even lowering rates shortly. This scenario may rally growth-oriented stocks, especially in technology and other sectors sensitive to borrowing costs.
However, if the unemployment increase is substantial, it could lead to broader market declines, as investors might fear a recession. In this case, defensive sectors like utilities, healthcare, and consumer staples—companies that provide essential services and goods—might see increased investor interest.
Scenario 3: Unemployment Meets Expectations
When the report aligns closely with economists’ forecasts, it generally has a more muted impact on the stock market. Investors might feel reassured that the Fed does not need to change its policy trajectory, maintaining the status quo. Sectors that thrive on stability, like industrials and consumer goods, may see steady or modest gains in response. However, any unexpected revision to prior data or surprises in associated metrics like labor force participation could still lead to short-term volatility.
Investor Strategy Ahead of the Report
Investors often hedge their portfolios before major data releases like unemployment reports, anticipating potential volatility. Given the impact of unemployment data on Federal Reserve decisions, many traders will closely watch interest-rate-sensitive stocks.
Defensive Stocks: Some investors may consider increasing their positions in defensive stocks, such as healthcare, consumer staples, and utilities, which historically perform well during economic downturns or high-volatility periods.
Interest-Rate Sensitive Stocks: With possible adjustments in monetary policy, sectors like technology and real estate could experience heightened volatility. Conservative investors might reduce their exposure to these sectors ahead of the release.
Financials: Banks and financial institutions often benefit from a rising-rate environment, so if the labor market remains strong, this sector may see positive momentum.
Long-Term Considerations
While unemployment data affects short-term trading sentiment, it is essential to consider the longer-term economic outlook. A single unemployment report will likely not shift the market’s trajectory unless the numbers are significantly out of line with expectations. For long-term investors, focusing on company fundamentals, sectoral trends, and the overall economic context may yield better returns than reacting impulsively to a single data release.
In conclusion, investors will watch November’s unemployment data closely for hints about the strength of the U.S. economy and clues about future Federal Reserve policy. As unemployment remains intertwined with inflation and consumer spending, any surprise in the report could set the tone for the stock market’s direction as the year closes.
Good Trading,
Adrian Manz
Using Intraday VWAP in Day Trading
A Guide to the Volume Weighted Average Price Strategy
The Volume Weighted Average Price (VWAP) is a widely-used technical indicator in day trading, especially for stocks. Calculated as a ratio between total dollars traded and total volume, VWAP gives insight into a stock’s average price based on volume throughout the trading session. Unlike a simple moving average, VWAP considers the volume of each trade, making it a useful tool for assessing the true average price over a specific period. In this article, we’ll explore the concept of intraday VWAP and how traders can leverage it to enhance their day trading strategies, with examples to clarify its application.
What is Intraday VWAP?
Intraday VWAP is calculated for the entire trading session and reset daily. The formula is straightforward:
VWAP=∑(Price x Volume)∑VolumeVWAP = \frac{\sum \text{(Price x Volume)}}{\sum \text{Volume}}
This calculation provides a dynamic benchmark reflecting price and volume over the day. The result is a line plotted on the chart that reflects the average price weighted by volume, helping traders identify where most trades happen relative to the stock’s price.
VWAP is particularly useful for day traders and institutions. It reveals whether a stock is trading above or below its average price, which is key in making buy or sell decisions.
How Intraday VWAP is Used in Day Trading
1. Benchmarking Fair Value
VWAP helps traders gauge a stock’s fair value intraday. If the price is above VWAP, buyers have more control; if the price is below VWAP, sellers dominate. This benchmark is valuable when traders want to assess the overall strength of price action.
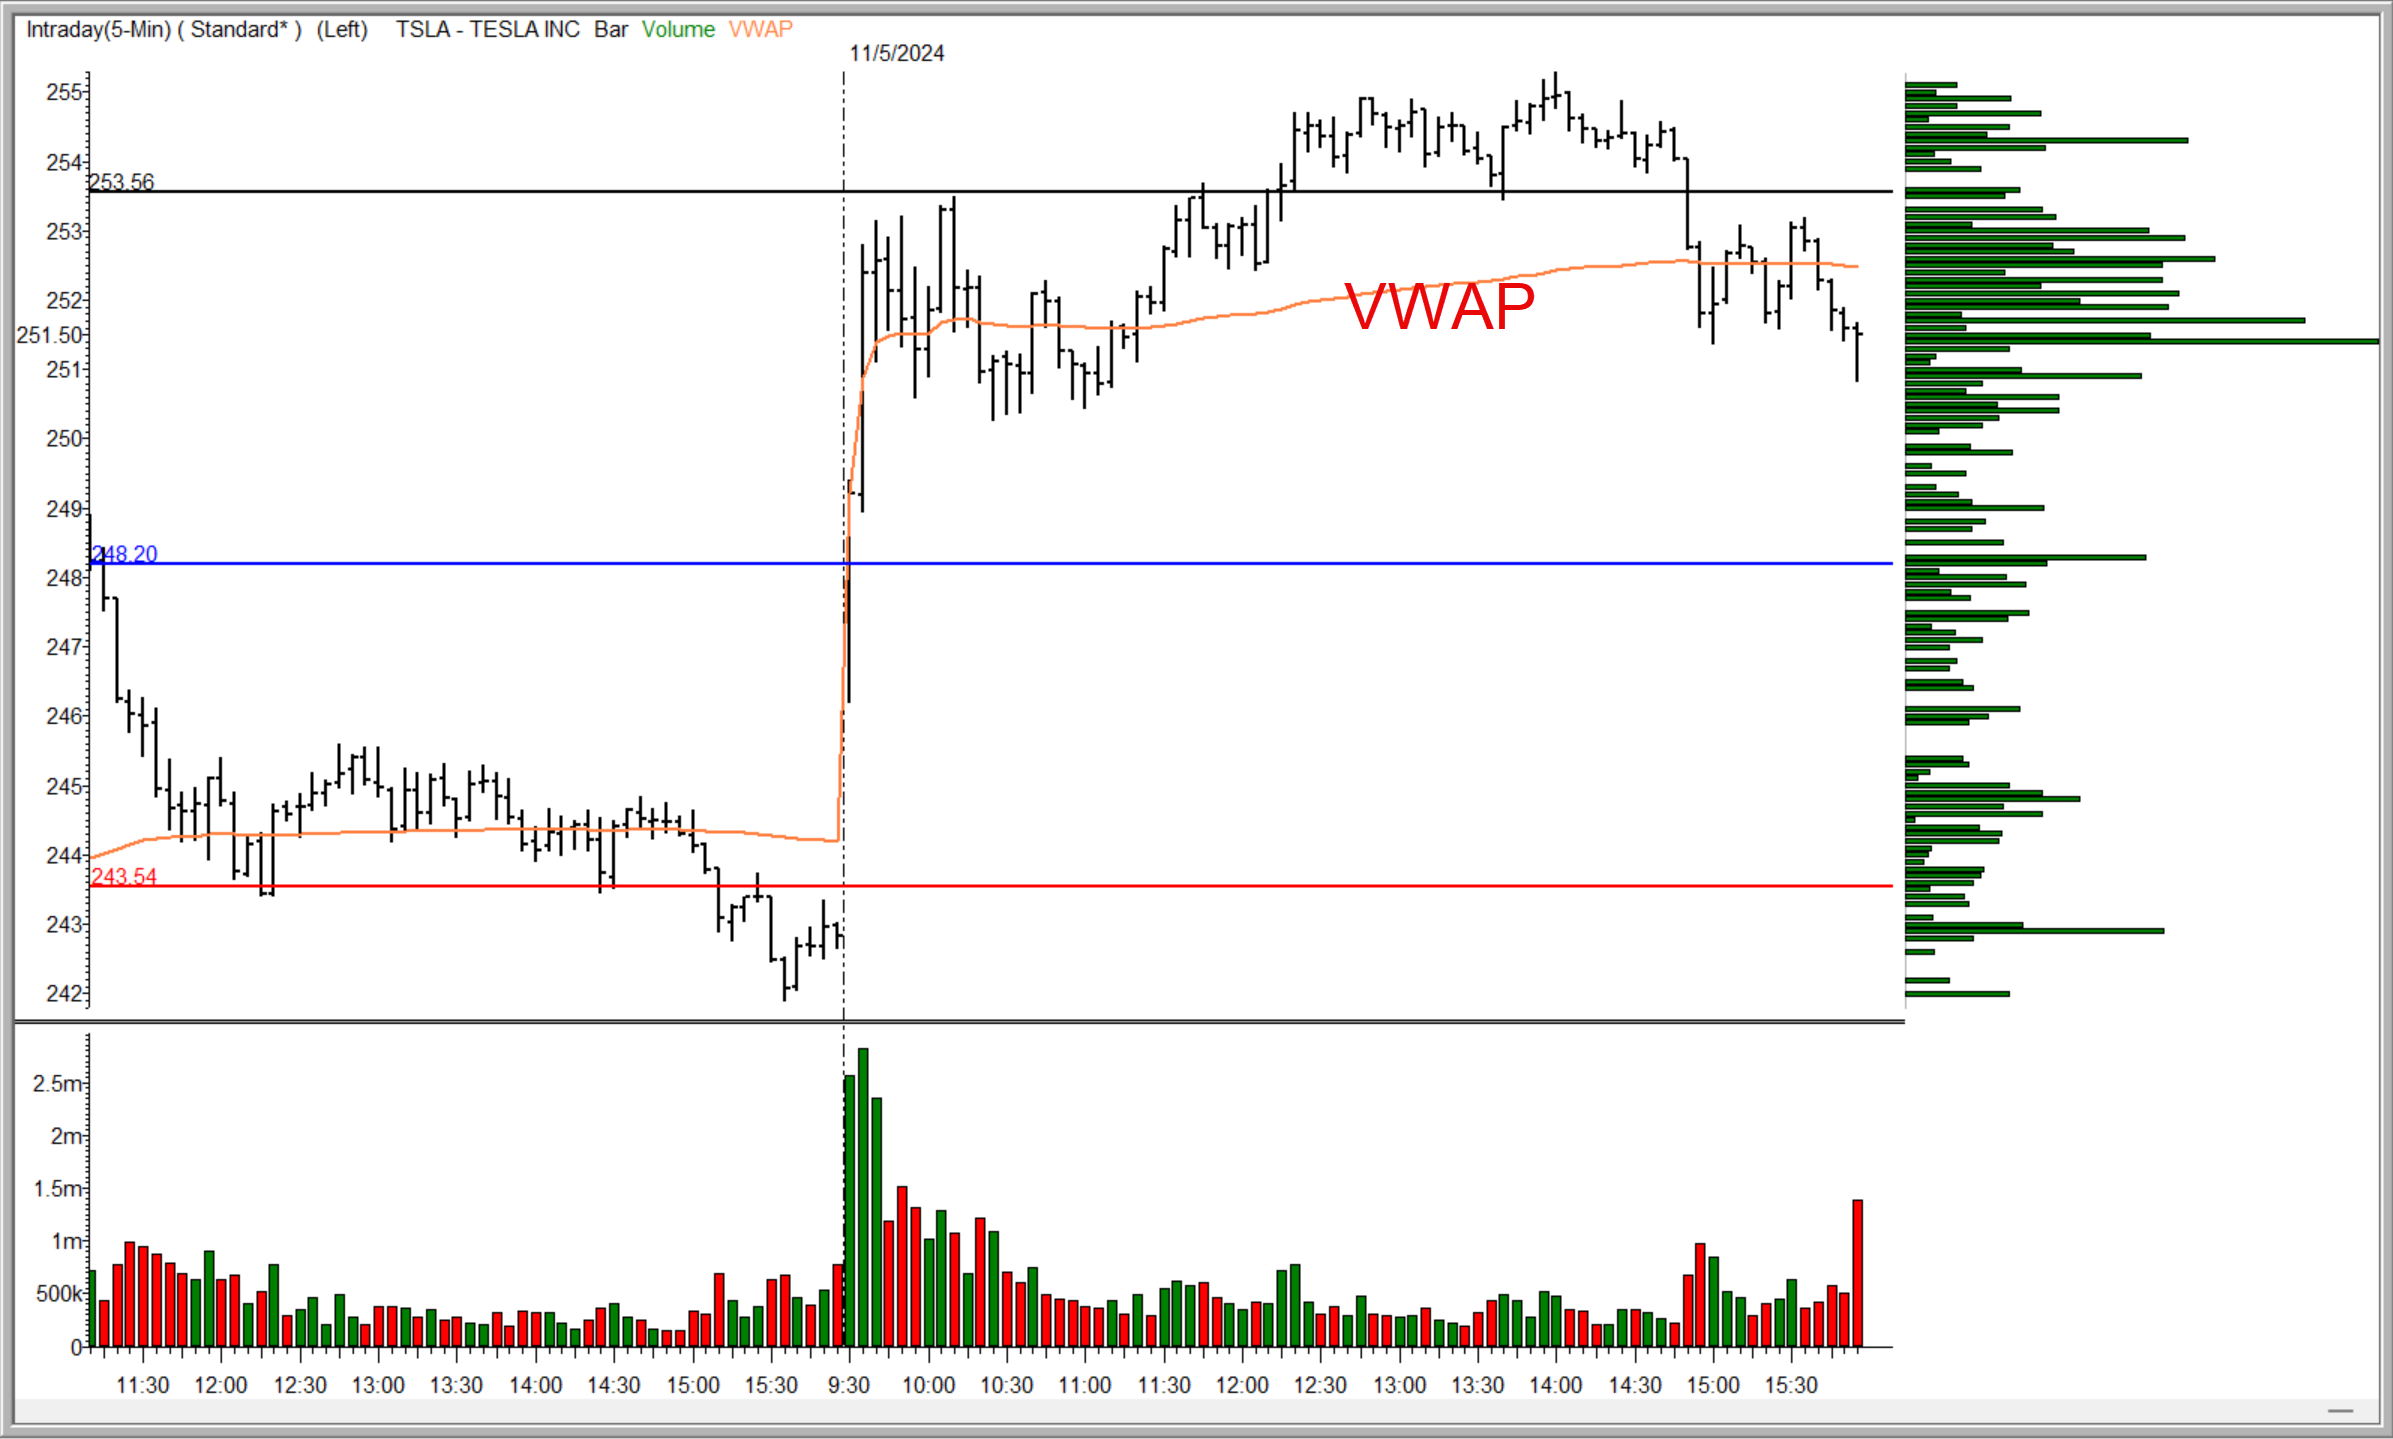
- Example: Let’s say Tesla (TSLA) opens strong, with the price trading above VWAP for most of the morning. For a day trader, this indicates bullish strength, meaning buying dips closer to VWAP could offer an advantageous entry point in line with the prevailing trend.
2. Identifying Optimal Entry and Exit Points
VWAP can be used to pinpoint intraday entry and exit points, as it often acts as support or resistance. A common strategy is to buy when a stock price approaches VWAP from above, as it can serve as a support level. Conversely, a stock price approaching VWAP from below can serve as resistance, indicating a potential exit point.
- Example: Imagine that Apple (AAPL) is in an uptrend but has temporarily returned to its VWAP line midday. A day trader may buy AAPL as it touches VWAP, expecting the uptrend to continue. If AAPL bounces off VWAP and moves higher, it confirms the support level. Conversely, if AAPL breaks below VWAP, it may indicate a reversal, signaling the trader to cut losses.
3. Trend Confirmation Tool
VWAP is often used as a trend confirmation tool. The trend is considered bullish when prices remain above VWAP, whereas prices consistently below VWAP suggest a bearish trend. Day traders can use VWAP in conjunction with other indicators to confirm their outlook.
- Example: A trader notices that Microsoft (MSFT) has been trending above VWAP throughout the day, reinforcing the bullish sentiment. They may hold onto long positions, only selling if MSFT breaks below VWAP, signaling a potential trend change. This approach can help maximize gains by staying aligned with the prevailing trend.
4. Minimizing Slippage for Institutional Trades
For larger traders and institutions, VWAP is a benchmark to gauge trade execution quality and minimize slippage. Institutions may strive to buy below VWAP and sell above it, which allows them to ensure that they’re trading at advantageous prices relative to the day’s volume-weighted average.
- Example: A hedge fund managing a large position in Amazon (AMZN) might split its orders over the day, striving to buy at or below VWAP. This minimizes market impact, allowing the institution to accumulate shares without paying above the stock’s average price for the day.
Integrating VWAP in a Day Trading Strategy
Step 1: Set Up Your VWAP Indicator
Most trading platforms offer VWAP as a built-in indicator. Plot it on your chart to visualize the stock price’s relative movement to VWAP throughout the trading day.
Step 2: Determine Market Bias
At the market open, observe whether the stock price is trending above or below VWAP. A stock opening and staying above VWAP indicates buying interest and a potential bullish bias, whereas trading below VWAP indicates a bearish bias.
Step 3: Identify Entry and Exit Points
For long positions, wait for pullbacks to VWAP, as it often serves as support in an uptrend. For short positions, consider selling when the stock price approaches VWAP from below in a downtrend, as it may act as resistance.
Step 4: Use VWAP with Stop Losses
VWAP is also useful for stop-loss placements. If you’re long, a break below VWAP can signal weakness, and you may want to exit the trade. Similarly, if you’re short and the price crosses above VWAP, it may indicate strength, signaling you to exit your short position.
Step 5: Avoid Overtrading Around VWAP
VWAP works best when the price interacts with it occasionally. Avoid overtrading when the price is tightly fluctuating around VWAP, as reading clear signals can be more challenging.
Real-World Example: VWAP in Action
Consider a scenario with Nvidia (NVDA) stock. Suppose NVDA opens the day with strong buying and quickly moves above VWAP. As NVDA trends upward, a trader watches for any pullback toward VWAP to establish a long position. Around midday, NVDA pulls back and touches VWAP, bouncing off it and continuing its upward trend. This support level confirms VWAP as a strong entry point, and the trader can ride the momentum.
Later, if NVDA fails to hold VWAP and breaks below it, the trader might consider this a reversal signal and exit the position to lock in profits. This intraday example illustrates how VWAP is both a support level and a trend confirmation tool.
Final Thoughts
The intraday VWAP is an essential indicator for day traders. It provides insight into fair value and guides entry and exit points. VWAP’s use as a support and resistance level, combined with volume-weighted insights, makes it a powerful tool for day trading strategies. Whether used alone or with other indicators, VWAP offers a clear visual of a stock’s strength and trend direction, helping traders make more informed decisions.
Like any indicator, VWAP is most effective when used with sound risk management and additional analysis. By understanding VWAP’s dynamics, traders can gain a valuable edge in navigating intraday stock price movements.
Good Trading,
Adrian Manz
Understanding Apple’s Intraday Price Patterns and the Role of Options Market Makers
Understanding AAPL’s Intraday Price Patterns
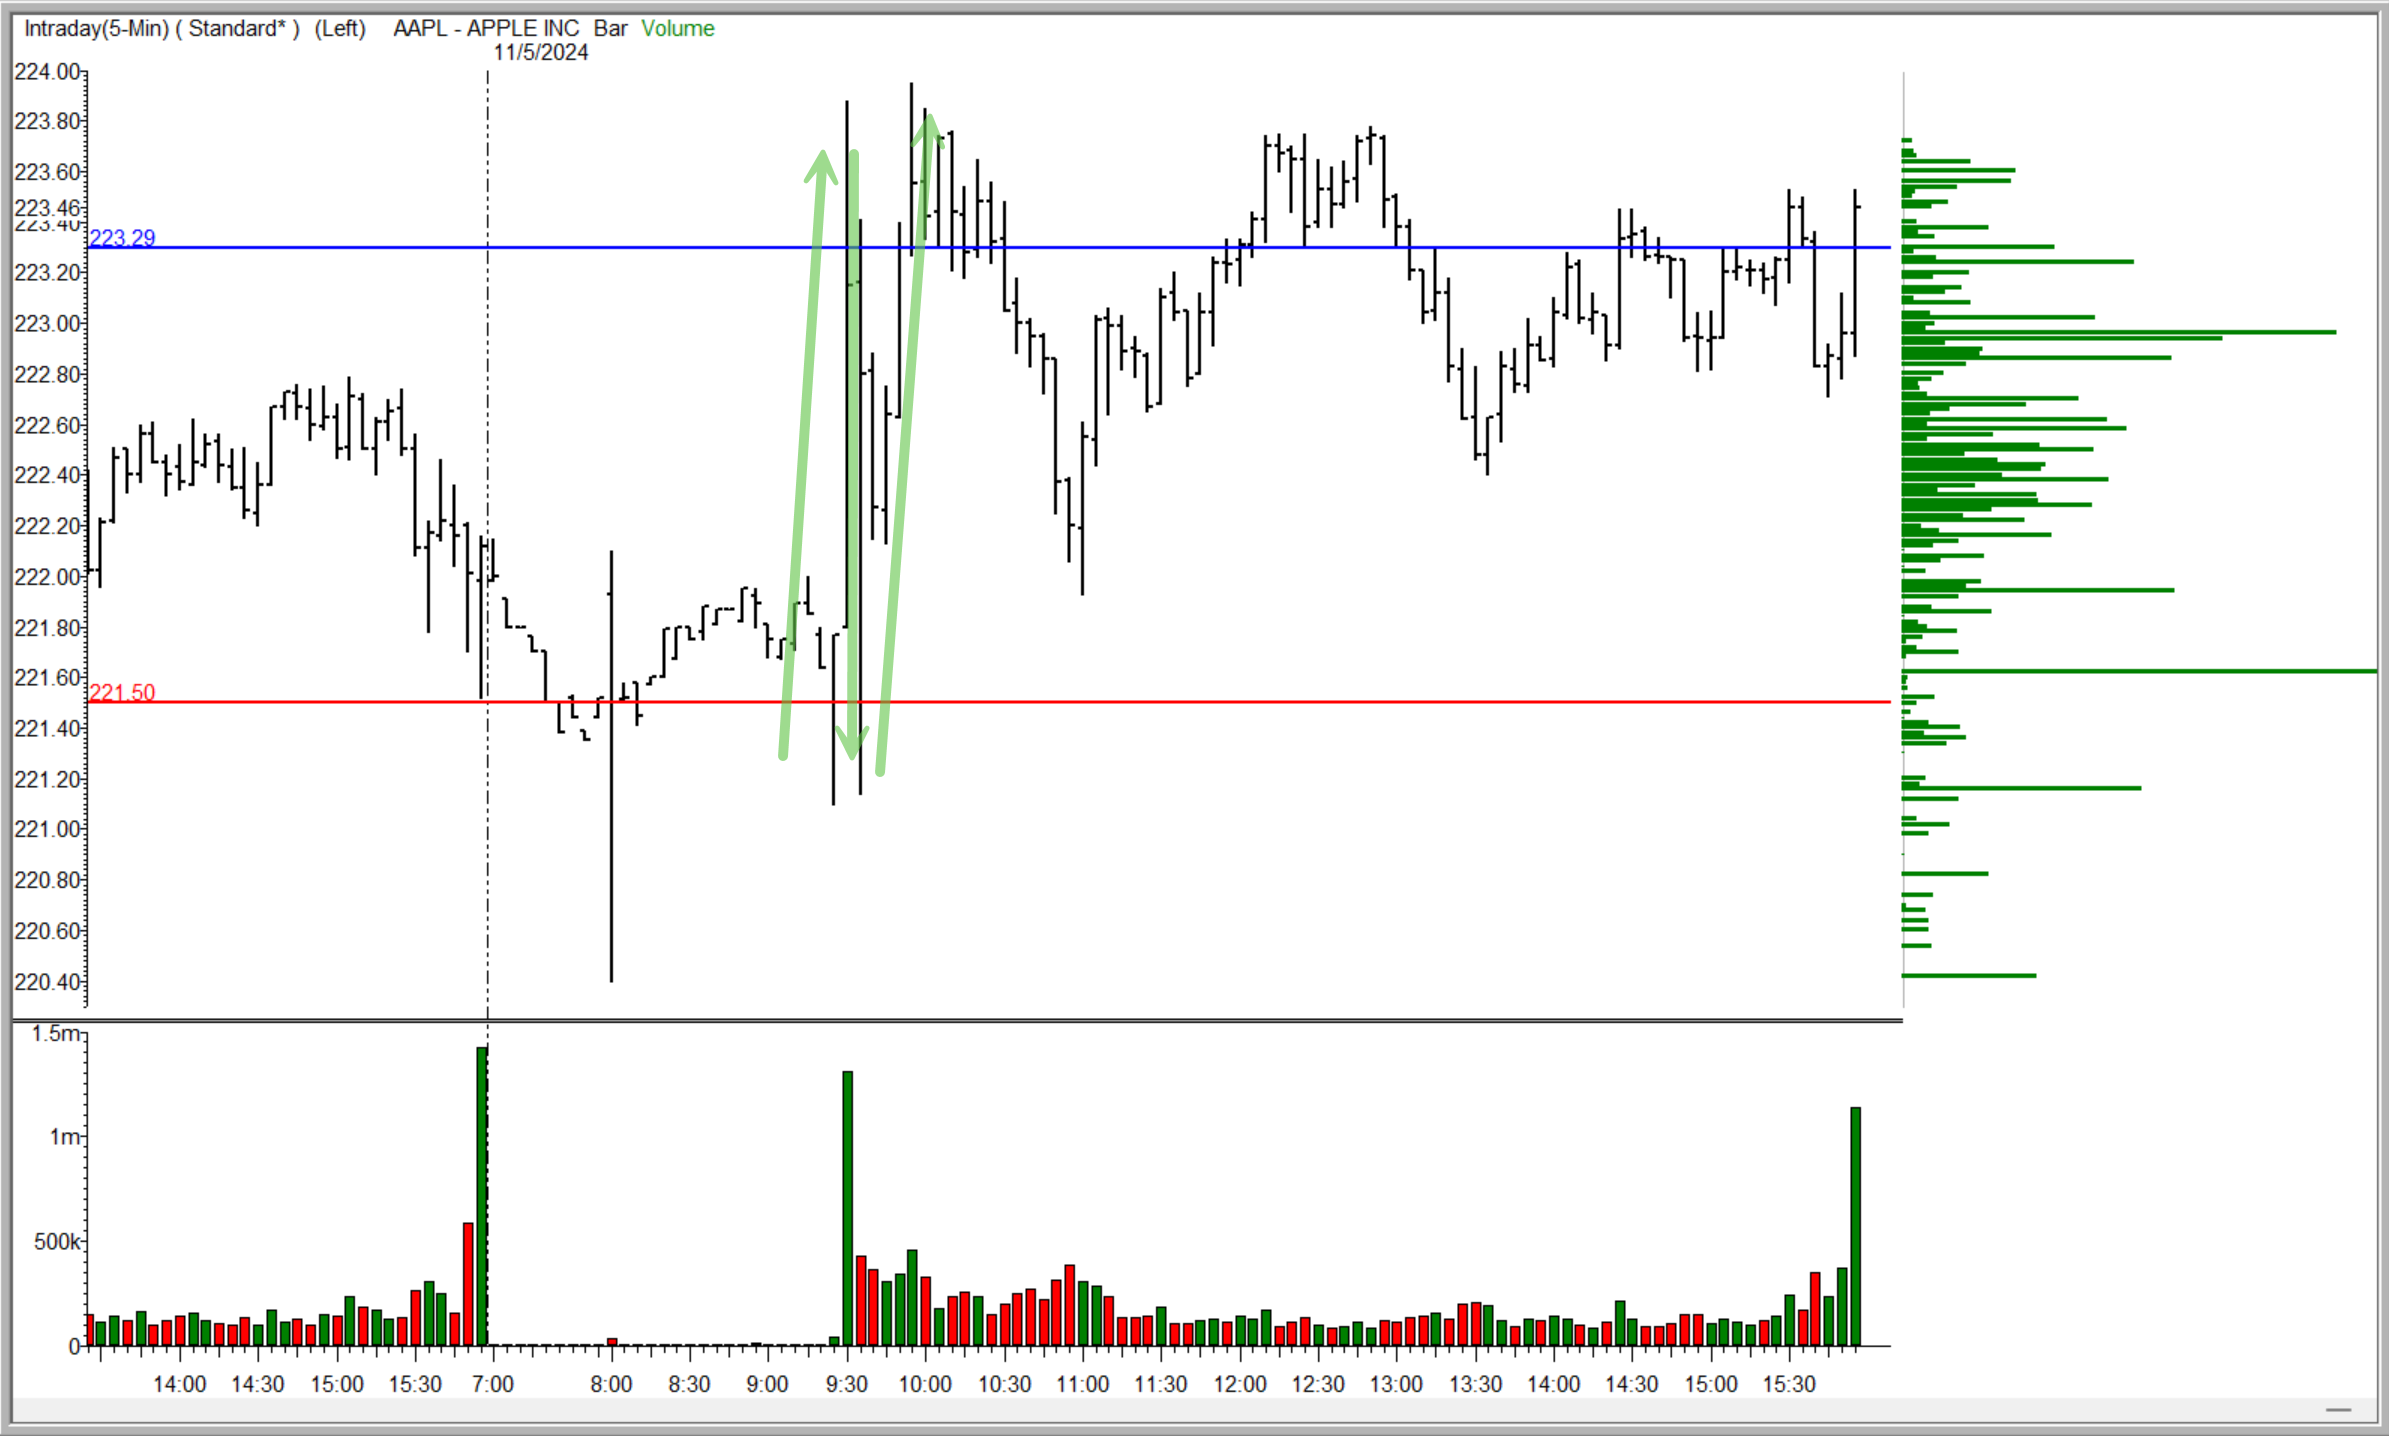
If you’re an active trader or investor following Apple Inc. (AAPL), you’ve likely noticed a recurring intraday price pattern: AAPL often surges at the open, retraces to premarket support levels, and then resumes an upward move, often retesting the initial high. This sequence isn’t just a coincidence or random volatility; it reflects underlying market dynamics influenced by demand and supply pressures, including the role of options market makers who hedge their positions. Understanding AAPL’s intraday price patterns and these forces can help you better anticipate AAPL’s price behavior and refine your trading strategies.
The Initial Surge: Buying Pressure and Market Sentiment
Apple is one of the market’s most liquid and widely traded stocks, making it highly responsive to market sentiment and external events. When trading opens at 9:30 a.m. EST, the price often experiences an immediate surge. A few key factors typically drive this movement:
- Overnight News and Market Sentiment: Events that unfold overnight, such as global economic data, geopolitical developments, or tech sector earnings reports, can dramatically shift investor sentiment. These shifts create pent-up demand that manifests as soon as the market opens. Traders who react to news after hours are eager to execute their buy or sell orders at the open, often causing sharp initial moves in the stock price.
- Market Orders and Volume Spikes: The opening bell sees a significant influx of market orders. Retail investors, hedge funds, and institutional investors place orders based on premarket trends, research, and overnight news. If sentiment is positive, these opening trades add substantial buying pressure to AAPL, pushing prices higher initially.
- Options Market Makers and Delta Hedging: Here’s where the mechanics of options come into play. Market makers who sell call and put options strive to stay delta-neutral, meaning they offset their exposure to directional moves in AAPL’s stock price by adjusting their stock holdings accordingly. At the open, if AAPL gaps up or shows strength, these market makers must buy shares to hedge the call options they sold. This buying, particularly in a stock as liquid as AAPL, can push prices higher in the opening minutes, contributing to the initial surge.
The Opening Retracement: Profit-Taking and Reduced Hedging Demand
After the initial surge, AAPL often retraces toward premarket support levels, a common technical behavior that signals a temporary easing in buying demand. Several factors fuel this pullback:
- Profit-Taking: The early spike in AAPL’s price provides a quick profit opportunity for traders who bought at the open. These early entrants often take profits soon after the surge, especially if their strategy is based on intraday momentum or scalping. This wave of selling pressure contributes to a retracement as demand weakens temporarily.
- Options Market Makers Adjusting Hedging Needs: The intense buying pressure tapers off once market makers have adjusted their delta hedges to account for the initial spike. Their need to purchase shares diminishes as AAPL stabilizes, leading to a momentary lull that allows the price to retreat to support levels. The impact of delta hedging is particularly significant in a stock like AAPL, which has high options trading volume and attracts traders and market makers alike.
- Testing Technical Levels: Many traders rely on technical analysis, and premarket support levels act as psychological floors for the stock. As AAPL pulls back, these levels attract new buyers and provide a base from which the stock can begin a secondary move.
The Secondary Move: Testing Highs and Renewed Buying Pressure
After a pullback to premarket support, AAPL often makes a second move, climbing back to the initial high established right after the open. This secondary push can be attributed to both technical factors and renewed hedging activity:
- Renewed Buying Interest and Technical Patterns: Traders who follow technical patterns may see the retracement as an opportunity to buy at support, creating a double-bottom formation that suggests further upside. Additionally, the initial high of the day serves as a natural resistance level, providing a target for this secondary upward move.
- Continued Hedging Adjustments by Market Makers: As AAPL’s price moves, options market makers continually adjust their delta hedges. If AAPL bounces off support levels, market makers may need to buy shares again to offset exposure, especially if the stock regains momentum. This renewed hedging activity creates upward pressure, which can return AAPL to its earlier highs. Market makers’ actions are more pronounced on days with high options volume and open interest, particularly near expiration dates.
- Self-Fulfilling Prophecy for Resistance: The initial high often becomes a short-term resistance level. This behavior draws in traders who use resistance as a selling or take-profit target, reinforcing the retest. Additionally, algorithmic trading models and high-frequency trading (HFT) systems are designed to capitalize on these predictable patterns, further reinforcing the price action.
Why This Pattern Matters to Traders
For active traders, understanding AAPL’s intraday price patterns can be advantageous:
- Timing Entries and Exits: Recognizing the likelihood of an initial surge, followed by a retracement, and then a secondary rise can help traders plan more precise entry and exit points. Traders who buy during the retracement may enjoy a better risk-reward ratio than those who chase the stock during the initial spike.
- Setting Realistic Profit Targets: If you’re targeting a retest of the opening high, this pattern provides a clear framework for setting profit goals based on past behavior. Setting realistic expectations allows for more disciplined trading.
- Leveraging Options Data for Insights: Observing options open interest and tracking delta exposure can reveal when market makers need to hedge, providing further insights into potential price movements. Elevated options volume or large open interest near key strike prices can indicate whether these moves will likely be amplified.
Final Thoughts
The intraday pattern of Apple’s stock—a surge, retracement, and second rise—reflects a mix of market psychology and options market maker activity. The role of delta and gamma hedging in highly traded stocks like AAPL cannot be understated; it creates demand dynamics that influence intraday price action. For traders who can recognize these patterns, there are opportunities to capitalize on predictable moves, particularly when combining technical analysis with insights into options market behavior.
By understanding the “why” behind these intraday moves, traders can better position themselves to ride Apple’s waves of demand and potentially improve their trading outcomes. As always, remember that market patterns aren’t guarantees but probabilities—staying flexible and adaptive is key.
Good Trading,
Adrian Manz