The Small Cap Swing Trader Alert Archive
Below you'll find The Small Cap Swing Trader setups stacked up and ordered chronologically.What ISM PMI Is & June’s Preview
📊 What ISM PMI Is & June’s Preview
- Definition: The ISM Manufacturing Purchasing Managers’ Index (PMI) is a key monthly survey that gauges new orders, production, employment, supplier deliveries, and inventories. A reading above 50 signals expansion, while below 50 signals contraction reuters.com
-
May’s Data: The May PMI stood at 48.5, marking the third consecutive month below 50, indicating continued contraction in U.S. manufacturing.
-
Forecast for June: Markets expect a slight uptick. Investing.com notes June’s PMI likely rose to 48.8 from a consensus of 48.5. Still below 50, but a move closer to neutral.
Market Implications of a Weak PMI
1. Equities
-
A weaker-than-expected PMI (~48.5) can dent industrial-heavy stocks (e.g., materials, energy) as it signals weaker corporate profits.
-
Conversely, signs of stabilization or a rebound toward 50 may support small-cap stocks, which historically benefit from early manufacturing improvements cambiar.com.
2. Fixed Income
-
A prolonged PMI below 50 fuels expectations of an easing Federal Reserve, which in turn cools the appetite for bonds.
-
Conversely, a surprisingly strong PMI (>50) might spark concerns about inflation, causing bond yields to rise and prices to fall.
3. Currency Markets
-
A weak PMI tends to weaken the U.S. dollar, lowering demand for U.S. debt and increasing dollar-denominated supply.
-
A stronger print can boost the dollar, especially if it reinforces a stronger-than-expected U.S. growth narrative.
4. Fed Policy
-
The Federal Reserve closely monitors the ISM PMI as a leading indicator of inflationary pressures and economic momentum.
-
Continued contraction would tilt the Fed more toward a hold or cut stance, while signs of strength might delay rate cuts or even prompt hawkish signals.
What to Watch in the June PMI Release (July 1 @ 10 a.m. ET)
| Scenario | Likely Market Reaction |
|---|---|
| Lower than forecast (~48) | Bonds rally, yields drop, dollar retreats, equities (esp. cyclicals) under pressure |
| As expected (~48.8) | Sideways in bonds and stocks; traders wait for the following data points or Fed minutes. |
| Above 50 (surprise) | Market trends could reverse—bonds sell off, dollar strengthens, cyclical stocks rally. |
Strategy Takeaways
-
Equity Allocation: Watch industrials and small-caps—early PMI strength tends to benefit these groups.
-
Bond Positioning: Bond investors should monitor the PMI for signs of a Fed pivot; a weak print is supportive of bonds.
-
Forex and Macro Plays: Traders in USD pairs or commodities, such as oil and metals, can use PMI-driven USD moves as a directional signal.
-
Fed Outlook: A soft PMI eases inflation pressure, supporting a dovish Fed bias—strong umpree might delay that.
Summary
The June ISM Manufacturing PMI, to be released July 1, holds significant sway over short-term market moves:
-
Equities: Especially cyclical sectors and small caps.
-
Bonds: Yield expectations hinge on PMI direction.
-
Currency: Dollar strength tied to economic surprise.
-
Fed policy: PMI remains a key Fed-watch input.
Whether the index remains in contraction territory, inches toward 50, or jumps into expansion, traders will interpret it through the lens of growth, inflation, and rate policy. A surprise beat could shift sentiment quickly, while a dovish miss could further affirm easing expectations.
How I Used RSI Divergence and Pivot Rejection to Short PLTR for a Clean VWAP Win
PLTR Trade Breakdown: A Short Setup Backed by Pivot Resistance, VWAP Reversion, and RSI Divergence
June 27, 2025
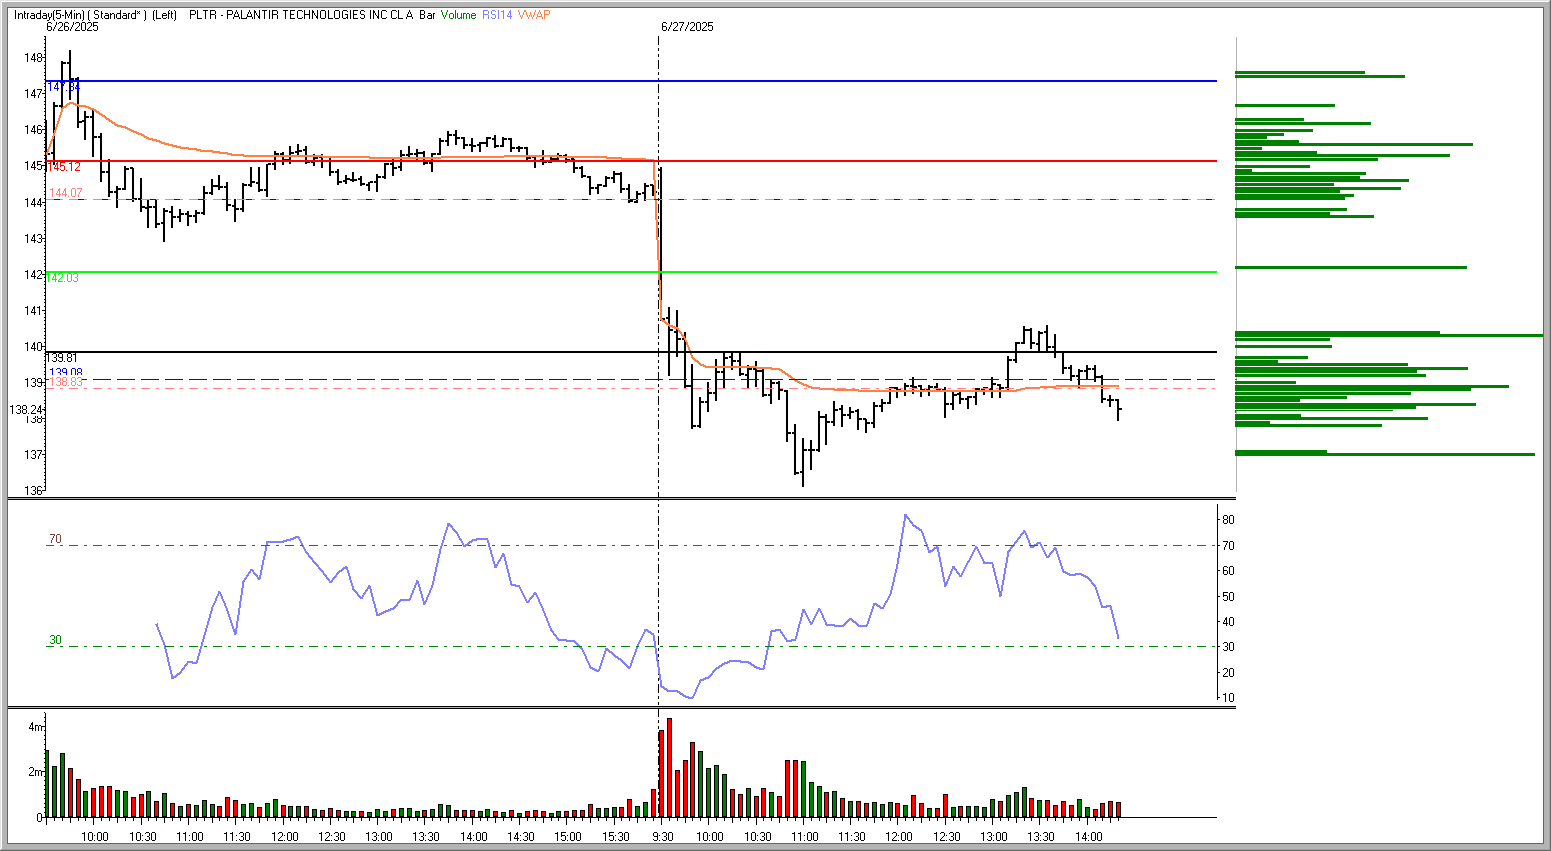
Today’s short in Palantir Technologies (PLTR) was a textbook intraday setup that brought together multiple high-probability signals. From pivot rejection to RSI divergence and VWAP targeting, the trade aligned market psychology and technical structure — offering a clean, risk-defined opportunity late in the session.
Trade Summary
-
Ticker: PLTR (Palantir Technologies)
-
Entry: Short at 139.78 (stop-limit order)
-
Time of Entry: 13:45 ET
-
Target: 139.08 (just above VWAP)
-
Tools Used: Pivot Points, VWAP, RSI (14), Volume-by-Price
The Setup Explained
🧭 Pivot Level Rejection
The S1 pivot level at 139.81 acted as a key resistance point. Price made a higher high into that level just before 13:45 but failed to break through meaningfully. This behavior indicated buying exhaustion, making it a prime location for a short entry, especially when other indicators supported a downside reversal.
🪞 Bearish RSI Divergence
Here’s what made the short especially compelling: as price made that higher high, the 14-period RSI made a lower high, forming a clear bearish divergence. Additionally, the RSI was rolling down through 70, indicating that the prior overbought condition was unwinding and momentum was fading.
This divergence is often one of the most reliable reversal signals when confirmed by price structure, and in this case, the failure at S1 made it actionable.
🎯 VWAP as a Target
The VWAP (Volume Weighted Average Price) sat around 139.08, offering a clear reversion magnet. In the afternoon, especially on reversal setups, VWAP tends to act as a gravitational pull for price, particularly after failed rallies.
Placing the target just above VWAP ensured a realistic exit and kept the trade out of the noise of potential mid-range chop.
📊 Volume-by-Price Void
The Volume-by-Price profile exhibited light participation between 139.60 and 139.10, creating a low-resistance pathway for the price to move quickly once it failed to hold below the S1 pivot.
A dense volume shelf was positioned near VWAP, indicating that supply would likely return to that zone. This made it the logical target — and further validated the decision to exit before buyers regrouped.
Execution Detail
At 13:45 ET, a stop-limit short at 139.78 was triggered as the price rolled over from the S1 pivot rejection. Momentum quickly shifted, and the price moved smoothly down toward the VWAP, achieving the exit at 139.08 with a limited drawdown.
This was a low-risk, high-conviction trade — the kind that forms when structure and psychology align.
Key Lessons and Takeaways
| Indicator | Insight | Role in the Trade |
|---|---|---|
| Pivot Points | S1 acted as resistance | Defined entry zone |
| RSI Divergence | Price ↑, RSI ↓ | Early warning of reversal |
| VWAP | Below S1 | Target and mean reversion anchor |
| Volume-by-Price | Light volume pocket | Gave room for clean move |
Conclusion
This PLTR trade exemplifies how RSI divergence, particularly when combined with pivot resistance and VWAP proximity, can provide razor-sharp intraday opportunities. Combined with volume profile clarity, it offered not just a strong entry but also a logical and highly probable exit.
Whether you’re actively trading or reviewing your own setups, this is a perfect example of how blending momentum, price structure, and volume logic can improve your edge.
June 27, 2025

Middle East conflict market impact
Middle East Conflict Market Impact: Scenarios Traders Must Watch
Tensions between Israel and Iran have reignited, and traders worldwide are asking: how will this affect market direction? The Middle East conflict market impact depends heavily on how the situation evolves—from diplomacy to all-out war. At TraderInsight, we break down the implications of five possible outcomes and what they mean for your trading strategy.

Scenario 1: Ceasefire or Diplomatic De-escalation
A de-escalation in hostilities would likely have a calming effect on global risk assets. Equities would rally, oil would pull back sharply, and defense contractors might retrace recent gains. A peaceful resolution limits the Middle East conflict market impact and restores appetite for risk-on trades. Look for bullish setups in tech, travel, and emerging markets.
Scenario 2: Escalation into Open Conflict
If fighting intensifies, expect a spike in oil prices and a global risk-off response. The Middle East conflict market impact would include a surge in volatility (VIX), aggressive rotation into safe havens like gold and treasuries, and possible bear flags forming across tech. Watch for oil to test $90+ if major energy infrastructure or shipping lanes are disrupted.
Scenario 3: Ongoing Stalemate
In a drawn-out stalemate, markets will likely chop sideways. Oil stays elevated. Risk premiums remain priced into the market, but no breakout momentum emerges. The Middle East conflict market impact here is more subtle—ideal for mean-reverting intraday setups and short-term scalps as traders digest headline risk in real time.
Scenario 4: Effective Israeli Strikes on Iran’s Nuclear Program
If Israel’s targeted strikes were as successful as former President Trump claimed, the market might interpret this as a removal of long-term risk. Oil would likely spike then normalize, equities could regain footing, and the Middle East conflict market impact would fade quickly—assuming there’s no counterattack. Look for tactical long entries on weakness.
Scenario 5: Limited, Ineffective Strikes (as suggested by DoD)
Should reports of symbolic or minimal damage prove accurate, expect a more prolonged period of uncertainty. Oil remains strong, defense sector continues higher, and volatility lingers. This version of the Middle East conflict market impact fuels concern over broader regional escalation and unresolved nuclear ambitions.
Conclusion: Trade the Reaction, Not the Headline
Uncertainty is the enemy of steady market trends, and geopolitical instability can create sharp, unpredictable swings. Regardless of the scenario, it’s the market’s reaction—not the news itself—that creates opportunity. At TraderInsight, we’ll keep dissecting the Middle East conflict market impact and helping you find setups that align with real-time sentiment.
Join us each morning in the War Room for strategy sessions that turn breaking news into trading edge.