
TSLA Rejects $400: A Three-Layer Trade Using SpotGamma, Bookmap and Price Structure
Tesla pushed directly into the psychologically important $400 level on July 14, 2026, but the better opportunity was not chasing the breakout. The cleaner setup developed when TSLA failed to hold above $400, order flow stopped advancing and the five-minute chart confirmed that sellers had regained control.
This TSLA $400 rejection trade is a useful example of how traders can combine three different forms of information: an options-derived market map from SpotGamma, real-time liquidity and execution data from Bookmap, and a defined price-action trigger on the five-minute chart.
The three-layer framework: identify the important level, watch how orders behave as price reaches it, and wait for the chart to confirm the trade. The level creates context. Order flow provides evidence. Price structure supplies the trigger.
Layer One: SpotGamma Identified $400 as the Key Gamma Strike
Before TSLA tested the level, SpotGamma identified $400 as the Key Gamma Strike. That immediately made the area important. A gamma level is not an automatic buy or sell signal, but it can become a powerful reference point because options positioning may affect hedging activity, liquidity and the way price behaves around the strike.
The HIRO display showed call-related activity expanding as TSLA moved toward $400. The push was strong enough to carry the stock through the level briefly, but the key question was whether that flow could sustain higher prices. As price moved above $400 and the advance began to stall, the character of the trade changed from a possible breakout to a possible failed breakout.
 SpotGamma placed the Key Gamma Strike at $400. Call-driven activity helped propel TSLA into the level,
but price could not maintain the breakout.
Layer Two: Bookmap Revealed the Liquidity Waiting Overhead
The next layer came from Bookmap. The heatmap showed meaningful liquidity near $399 and $400. That visible supply mattered because TSLA was no longer moving through an open area. Buyers were pushing into a zone where larger resting offers were waiting.
A bright liquidity band does not guarantee a reversal. Orders can be pulled, absorbed or traded through. The important information was how price responded. TSLA repeatedly pushed into the overhead liquidity, but the auction did not continue cleanly higher. The stock rolled away from the offers and aggressive selling began to appear as the price dropped back toward the upper $398 area.
That behavior provided evidence that the breakout was not gaining acceptance. Buyers had reached the level, but they were not yet demonstrating the ability to clear it and hold above it.
 Bookmap showed substantial liquidity near $399 and $400. The failed push through that supply helped confirm
that the breakout was losing strength.
Layer Three: The Five-Minute Chart Supplied the Trigger
The five-minute chart completed the setup. TSLA reached approximately $400.26, but the move above $400 did not hold. Price then fell back beneath the nearby $399.08 reference level.
This is where a market opinion becomes a structured trade. The thesis was no longer simply that $400 looked expensive or that a round number might create resistance. The thesis was that TSLA had attempted a breakout, failed to gain acceptance above the Key Gamma Strike and then lost the price structure that had supported the advance.
A trader could use the break beneath $399.08, or a weak bounce that failed to reclaim it, as the short trigger. The chart then provided objective downside references at $397.23 and $396.08. If selling momentum continued, the lower levels near $394.97 and $393.70 offered additional reference points.
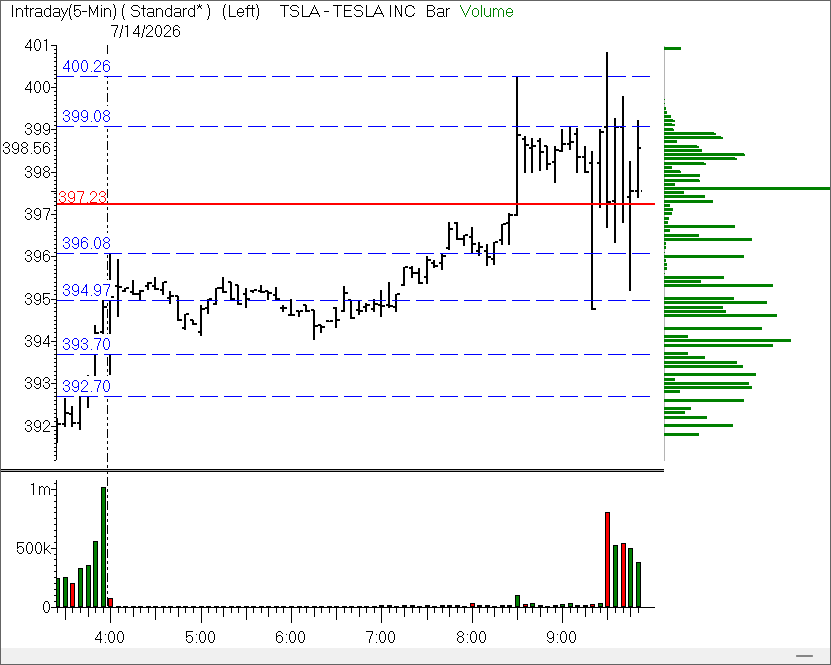 TSLA traded as high as $400.26, failed to hold the breakout and dropped back below $399.08.
The next marked support references were $397.23 and $396.08.
How the TSLA $400 Rejection Trade Could Be Structured
The trade can be organized around a clear sequence rather than a prediction:
- Context: TSLA approaches the $400 Key Gamma Strike after a strong intraday advance.
- Evidence: Bookmap shows meaningful offers near $399 and $400, and price fails to auction cleanly through them.
- Trigger: The breakout above $400 fails and TSLA loses the $399.08 chart level.
- Risk: A protective stop can be placed above the failed-breakout area, sized according to the trader’s predetermined risk limit.
- Targets: $397.23 becomes the first downside reference, followed by $396.08 if selling continues.
The precise entry and stop will vary with execution style. A faster trader may act as price breaks beneath the trigger. A more conservative trader may wait for a bounce that cannot reclaim $399.08. In either case, the trade should be defined before entry, including the maximum acceptable loss and the conditions that would invalidate the setup.
Why Blindly Shorting $400 Would Have Been the Wrong Process
It is tempting to assume that a stock should reverse simply because it reaches a large round number. That approach substitutes opinion for process. TSLA could have absorbed the liquidity at $400, held above the strike and accelerated higher. Traders who sold too early would have been exposed to exactly that possibility.
The higher-quality decision was to wait. First, allow price to reach the level. Next, observe whether buyers can clear the resting supply. Finally, require the five-minute chart to show that the attempted breakout has actually failed.
Do not short a stock merely because it has reached resistance. Wait for the market to show that the resistance is holding.
The Larger Trading Lesson: Confluence Is a Sequence
Traders often talk about confluence as if it were a collection of indicators appearing at the same time. In practice, the sequence is more important than the number of tools on the screen.
SpotGamma identified where the trade could matter. Bookmap showed what market participants were doing at that location. The five-minute chart identified when the trade became actionable. Each tool answered a different question:
- Where should we pay attention? The $400 Key Gamma Strike.
- What is happening there? Buyers are encountering substantial overhead liquidity and failing to sustain the auction higher.
- When is the setup confirmed? When price rejects the breakout and loses the supporting five-minute level.
This framework helps prevent anticipation, chasing and emotionally driven entries. It also creates a repeatable process that can be reviewed after the trade.
See These Opportunities Develop Live
Inside the TraderInsight War Room, we combine preplanned levels, real-time order flow and defined chart triggers to identify structured trading opportunities during the market session.
Educational disclaimer: This material is provided for educational purposes only and is not investment advice or a recommendation to buy or sell any security. Trading involves substantial risk, and past examples do not guarantee future results. Levels and observations discussed here reflect a specific intraday market environment and may change rapidly.