
The Small Cap Swing Trader Alert Archive
Below you'll find The Small Cap Swing Trader setups stacked up and ordered chronologically.Trading Confluence With Bookmap and SpotGamma
Trading Confluence: How I Use the 5-Minute Chart, Bookmap, and HIRO Together
One of the easiest mistakes traders make when they add more technology to their screens is assuming that more information automatically leads to better decisions.
It doesn’t.
The real advantage comes from understanding what question each tool is supposed to answer.
That was the lesson in a Tesla trade we worked through in the War Room today. TSLA had already made a substantial move higher, but as the session progressed, the advance began to lose some of its momentum. On the five-minute chart, price started building one of our familiar Infield Fly reversal structures near an area where the stock had already struggled to move higher.
That gave me a trade idea.
It did not, by itself, give me certainty.
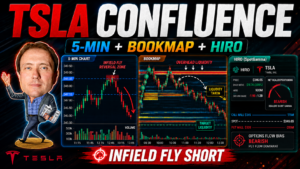
What made the trade interesting was the trading confluence with Bookmap and HIRO. The conventional chart showed me the setup. Bookmap helped me understand the liquidity battle taking place around the setup. HIRO added another layer by showing what was happening in the options-driven hedging environment.
Those are three different jobs.
When they start telling a compatible story, the trade becomes much easier to manage.
The Five-Minute Chart Gives Me Structure
I always want to start with price.
Bookmap and options-flow tools can provide tremendous insight, but I don’t want them manufacturing trades for me. I want the chart to identify an opportunity first.
In this case, TSLA pushed into roughly the $348.33 to $349 area and repeatedly struggled to extend through it. The five-minute chart began showing an upper-tail reversal structure that fit what we call an Infield Fly.
The trade logic was straightforward: if price violated the low of the reversal bar, I had a potential short entry, with the structure’s high providing a logical reference point for risk.
My initial target was near $347.15, an area already visible on the five-minute chart as prior support and resistance.
That distinction is important.
The chart answered:
Where is the trade?
It gave me the pattern, entry logic, stop reference and potential target.
But once I was in the position, another question became much more important:
Is the market behaving in a way that supports the trade?
That’s where Bookmap became extremely useful.
Bookmap Shows Me the Battle Behind the Candles
A five-minute candle is a summary.
Bookmap lets us look inside that summary.
As TSLA formed the reversal, we could see substantial liquidity sitting above price. When the stock attempted to push higher, liquidity repeatedly appeared around the $349 area. The stock could probe into it, but it wasn’t simply accelerating through it.
That mattered because the five-minute chart was simultaneously telling us that upward momentum was beginning to fail.
In other words, the chart said:
Potential rejection.
And Bookmap said:
Something overhead appears to be making further progress difficult.
That is trading confluence.
The lesson, however, isn’t simply to look for the brightest line on a Bookmap heatmap.
Some displayed liquidity is persistent. Some appears and disappears. Some may be there to execute. Other orders may be there only briefly and can be pulled before price reaches them.
During this trade, liquidity repeatedly appeared above the market around the area where the Infield Fly was forming. As I explained during the session, the important question was whether that liquidity remained persistent as price approached it or disappeared when challenged.
That’s a very different way of using Bookmap.
I’m not saying:
“There’s a big line, so price has to reverse.”
I’m asking:
“How is price behaving when it encounters this liquidity?”
Persistent Liquidity Is More Important Than a Screenshot
One of the biggest improvements traders can make with Bookmap is to stop thinking of liquidity as a static object.
It is an interaction.
Suppose 5,000 shares appear above the market.
That number alone doesn’t tell me very much.
I want to know:
Does the liquidity remain there as price approaches?
Does price repeatedly reject from it?
Are trades actually executing there?
Does the liquidity disappear before price arrives?
Does it reappear at a different level?
Does aggressive buying hit the offer but fail to advance price?
Those behaviors tell a story.
During the TSLA trade, some liquidity appeared, disappeared and relocated. Other areas remained relevant enough to repeatedly interfere with price. The latter was far more important to my decision-making than simply seeing a bright heatmap band.
This is why watching Bookmap live—or replaying it afterward—is so much more useful than looking at a single screenshot.
You’re watching a negotiation.
Then There Was HIRO
The third piece of the puzzle was SpotGamma HIRO.
HIRO gives us a different perspective because it is looking at options activity and the potential hedging pressure associated with that activity.
Again, I don’t want HIRO to become an entry signal.
The five-minute chart still owns that job.
What HIRO can help me understand is whether the options market appears to be supplying another force that is consistent—or inconsistent—with what I’m seeing in the underlying stock.
In this TSLA example, HIRO showed a very strong early move as Tesla rallied. But later, as TSLA worked into the $348-$349 area, that impulse was no longer accelerating in the same fashion.
That’s useful information.
Price had made a strong move.
The five-minute chart was showing slowing upside progress.
Bookmap was showing repeated overhead liquidity.
And the options-flow picture was no longer showing the same acceleration that accompanied the earlier advance.
Notice the wording there.
None of those things individually said:
“Short Tesla.”
Together, however, they gave me a much more complete picture of what was happening.
That’s trading confluence with Bookmap and HIRO.
Three Tools, Three Questions
I find it useful to think about the process this way:
| Tool | Question I’m Asking |
|---|---|
| 5-Minute Chart | Where is the setup? |
| Bookmap | What is happening to liquidity and order flow around the setup? |
| HIRO | Is the options/hedging environment adding pressure or removing it? |
The mistake is letting all three tools answer the same question.
They shouldn’t.
If I start searching Bookmap for a trade before I have a price-action setup, I can find a reason to trade almost anything.
If I stare at HIRO and try to buy every increase or sell every decrease, I lose the context the stock itself provides.
And if I use nothing but the five-minute chart, I may miss information about why price is hesitating at a critical level.
The value comes from combining them without confusing their roles.
The Most Valuable Information Came After the Entry
This TSLA trade became particularly interesting after we were already short.
Price didn’t immediately collapse.
In fact, the first entry reversed enough that TSLA came fairly close to the original stop before forming another Infield Fly opportunity. The original setup remained intact, and we effectively had a second opportunity to participate in the same thesis.
Then price began working lower.
Slowly.
Very slowly.
And this is where traders frequently sabotage otherwise good trades.
You enter expecting the stock to move immediately. It stalls. It bounces. It sits there. You begin interpreting the lack of immediate gratification as evidence that the trade is wrong.
But Bookmap was showing us something different.
The stock appeared to be pinned between liquidity levels.
Price would push lower, encounter liquidity, ricochet, and try again. At one point, the trade repeatedly struggled around approximately $347.90. Rather than ignoring that behavior, I used it to adjust risk. If TSLA could not clear that area convincingly, moving the stop toward breakeven made sense.
That is another important use of confluence.
The tools aren’t only useful for entering trades.
They can help you manage trades intelligently after the entry.
Sometimes a Stall Is Information
Eventually, we saw a much larger order move through a significant block of liquidity.
That was exactly the type of event I had been waiting for.
The market had spent time bouncing around above the liquidity. Then aggressive activity finally pushed through it. In the video, I described the repeated ricochet as the market appearing to build an order before making the next move.
This doesn’t mean we can know who was behind the orders.
We can’t.
“Algorithms,” “dealers,” “market makers” and institutional participants are useful shorthand when discussing market mechanics, but the screen doesn’t hand us the identity or intention of every participant.
What we can observe is behavior.
Liquidity was present.
Price struggled against it.
Pressure accumulated.
Then it traded through.
That sequence is much more useful than trying to assign a story to every individual order.
Confluence Can Also Tell You When to Get Out
The original five-minute chart gave me the $347.15 area as a logical target.
As TSLA approached that area, Bookmap began showing another liquidity problem—this time below the market.
That changed the equation.
The target derived from conventional technical analysis was now lining up with visible liquidity capable of slowing the decline.
That is almost a textbook example of confluence.
The chart said:
This is support.
Bookmap said:
There are buyers/liquidity appearing in this neighborhood.
And because the stock had already taken longer than I would normally like to reach the objective, I didn’t see a compelling reason to demand significantly more from the trade.
I took the target rather than forcing an extension.
Could Tesla continue lower afterward?
Of course.
That’s not the question.
The question is whether the information available at that moment justified staying in the position.
There is a big difference.
HIRO Levels Can Add Another Layer to the Map
The HIRO screen also gave us several important reference levels, including the $345 Call Wall visible during the session.
That did not mean TSLA had to go to $345.
It meant that if price continued lower, $345 was an area deserving additional attention because options positioning could influence how dealers responded as price approached the level.
Now we have another hierarchy:
$347.15: immediate chart-derived target.
Bookmap liquidity: real-time evidence of whether price was likely to move cleanly through that area.
$345 HIRO/SpotGamma level: a potentially important downstream options-positioning reference if the selloff continued.
That’s much more useful than simply saying, “Tesla looks bearish.”
We’re building a map.
Confluence Is Not Confirmation Bias
One danger here deserves attention.
Traders love confirmation.
Once we’re short, suddenly every red bubble, every sell order and every downtick looks bearish.
That’s not confluence.
That’s confirmation bias.
Real trading confluence with Bookmap and HIRO includes looking for evidence that proves your trade wrong.
If I’m short, I want to know:
Is overhead liquidity being consumed?
Is displayed resistance getting pulled?
Are buyers repeatedly lifting offers and advancing price?
Is HIRO accelerating higher again?
Is price reclaiming the Infield Fly structure?
Is the supposed support beneath the market disappearing?
If those things begin happening, the story has changed.
Your job isn’t to defend the trade.
Your job is to interpret the information.
Think in Terms of Evidence, Not Predictions
This is probably the most important lesson from the entire example.
Neither Bookmap nor HIRO provides absolutes.
And they shouldn’t be used that way.
As I said during the trade, the utility comes from watching the “game that’s being played” and identifying where the pieces begin lining up.
The five-minute chart might show a reversal.
Bookmap might reveal persistent sellers overhead.
HIRO might show that the options-driven momentum supporting the earlier rally has stopped accelerating.
That’s evidence.
Now imagine the opposite.
The five-minute chart forms an apparent bearish reversal, but Bookmap shows the overhead liquidity disappearing and aggressive buyers repeatedly lifting the offer while HIRO accelerates sharply higher.
Same candle.
Very different trade.
That’s why trading confluence with Bookmap and HIRO can be so valuable.
The Hierarchy Matters
For me, the sequence is:
Price action → liquidity → options context → execution and management.
Not the other way around.
I don’t want a sophisticated tool convincing me to ignore what price is doing.
The five-minute chart creates the trade thesis.
Bookmap helps me examine whether the underlying auction is behaving consistently with that thesis.
HIRO helps me understand whether options-related activity may be adding another tailwind or headwind.
Then I manage risk based on what happens next.
That hierarchy keeps all of the additional information from turning into noise.
Watch the Video: The TSLA Trade in Real Time
[VIDEO EMBED — TSLA / BOOKMAP / HIRO TRADE REVIEW]
The accompanying video is useful because you can actually watch this process unfold.
Rather than repeating the entire lesson from this article, the video focuses on the specific Tesla trade: the Infield Fly formation, the short entry, the second opportunity, the liquidity that repeatedly interfered with price, the eventual push through that liquidity, and the decision to take the profit objective as TSLA approached our support area.
The article gives you the framework.
The video lets you watch the framework being applied.
The Takeaway
One indicator doesn’t have to tell you everything.
In fact, I would argue that it shouldn’t.
The five-minute chart is exceptionally good at showing structure.
Bookmap is exceptionally good at showing the changing liquidity environment around that structure.
HIRO gives us another window into the options market and the hedging forces that may be affecting the underlying stock.
When all three point to the same conclusion, I become more confident.
When they disagree, I become more cautious.
And when they begin changing after I’m already in the trade, they can help me decide whether to hold, reduce risk, take the target or get out.
That is the real value of trading confluence with Bookmap and HIRO.
It isn’t about finding three indicators that agree with you.
It’s about using three different sources of information to understand what the market is actually doing.
Mental Insight: Why We Defend the Very Behaviors Holding Us Back
Understanding Cognitive Dissonance and the Hidden Science of Self-Deception
Mental Insight explores the psychology, neuroscience, and behavioral science behind consistent performance under pressure. These articles explain why we think, learn, decide, and perform the way we do—and how understanding those processes can help us become more consistent in trading, work, relationships, and life.
Have you ever caught yourself explaining away a mistake, even while quietly knowing you could have handled the situation better?
Maybe you blamed a difficult conversation on the other person’s attitude. Perhaps you justified skipping a workout because you were simply too busy. Or maybe you held onto a losing trade longer than your plan allowed because you were convinced the market would eventually come back.
Most of us like to think of ourselves as reasonably objective. We believe that when presented with evidence, we evaluate it fairly and adjust our thinking accordingly. But one of the most influential ideas in social psychology suggests that human beings are not quite that simple.
When our behavior conflicts with what we believe about ourselves, the resulting discomfort can be surprisingly powerful. Rather than immediately changing the behavior, we may change the explanation. We reinterpret what happened, minimize its importance, blame circumstances, or find another way to preserve the image we already have of ourselves.
Psychologists call this cognitive dissonance.
Understanding cognitive dissonance in trading is especially important because traders constantly make decisions that become visible almost immediately. Every trade provides an opportunity to evaluate what we did, why we did it, and whether we followed our process. It also gives us an opportunity to explain away behavior we would rather not examine too closely.
The Science of Cognitive Dissonance
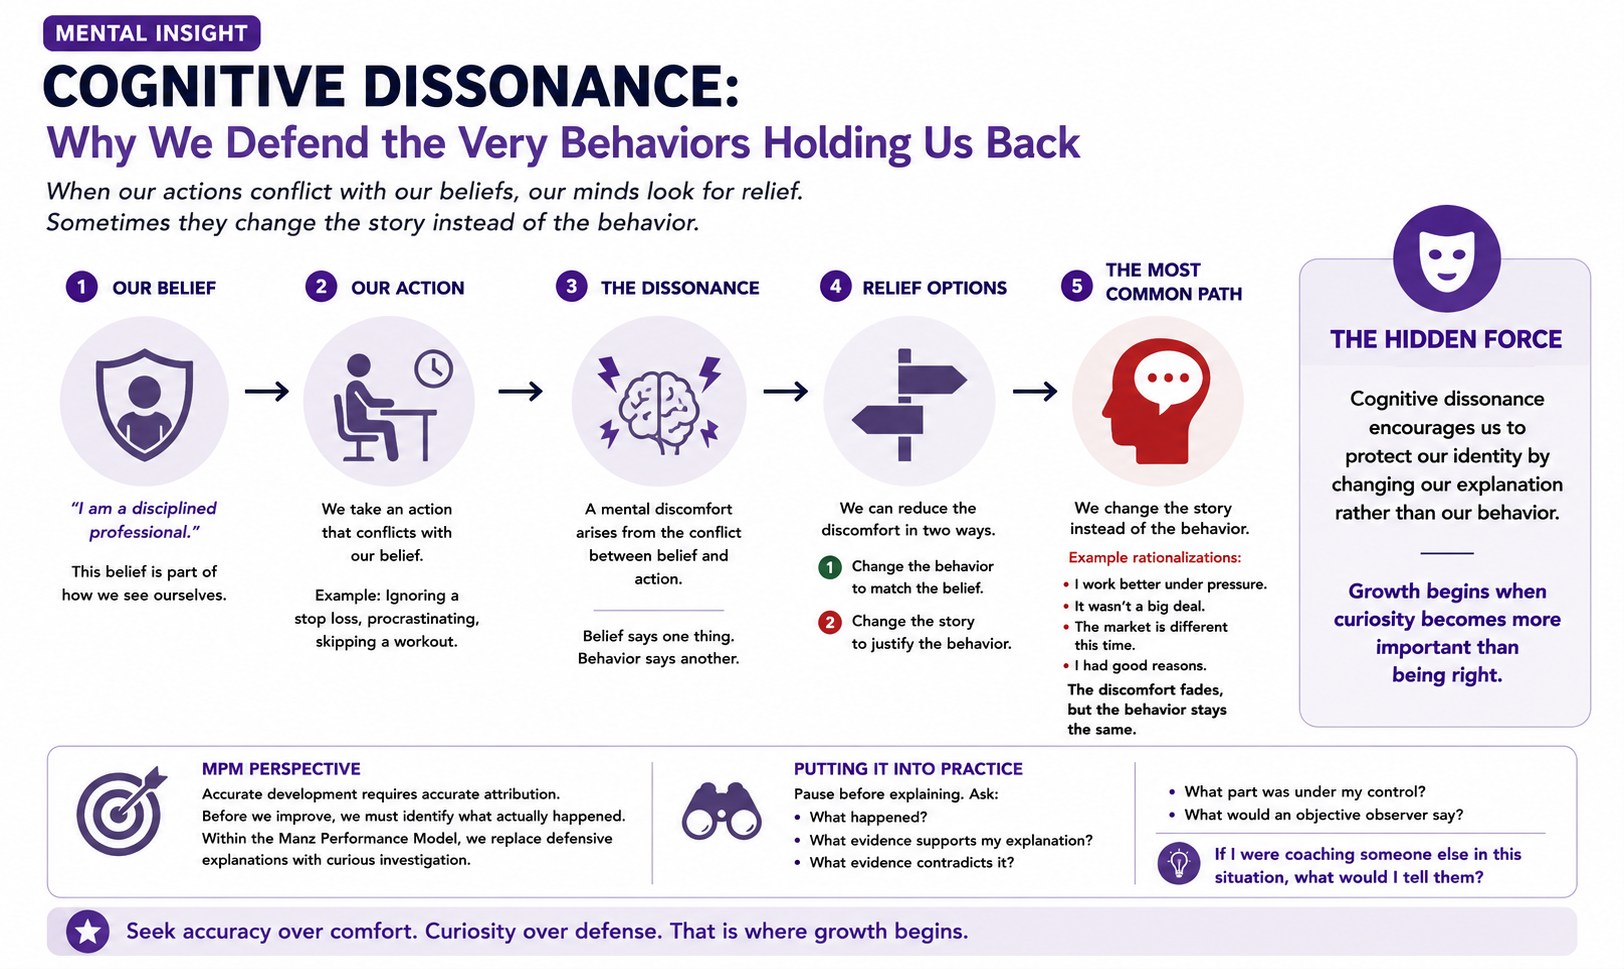
In 1957, social psychologist Leon Festinger introduced the theory of cognitive dissonance. The basic idea is surprisingly simple: people are motivated to maintain some degree of consistency among their beliefs, attitudes, and behavior. When those things conflict, psychological discomfort arises.
Imagine someone who genuinely believes, “I am a disciplined professional.” Now imagine that same person procrastinating on an important project, ignoring a well-established rule, or acting impulsively under pressure.
Two incompatible ideas are now present at the same time:
I am disciplined.
and
I just behaved in a way that was not disciplined.
That contradiction creates discomfort. Something has to give.
The most obvious solution would be to acknowledge the behavior and change it. But that is not the only way to reduce dissonance. We can also change the story we tell ourselves about what happened.
Instead of saying, “I procrastinated,” we might say, “I work better under pressure.”
Instead of admitting, “I ignored my trading plan,” we might say, “This situation was different.”
Instead of acknowledging, “I didn’t want to take the loss,” we might say, “I was giving the trade enough room to work.”
The emotional discomfort becomes smaller, but the underlying behavior remains unchanged.
That is what makes cognitive dissonance such an important performance issue. The explanation can feel satisfying while quietly preventing development.
Why Cognitive Dissonance Matters for Performance
Cognitive dissonance appears anywhere people care about competence, identity, or status.
A physician may become attached to an initial diagnosis and discount contradictory evidence. A business leader may continue supporting a strategy because admitting that it is failing would mean acknowledging an earlier mistake. An athlete may blame equipment rather than examine preparation. A student may decide a test “didn’t really matter” after receiving a disappointing grade.
None of those explanations are necessarily false. Equipment really can fail. Other people really can contribute to problems. Market conditions really do change. The problem arises when the first explanation we reach for is the one that best protects us rather than the one best supported by the evidence.
That distinction becomes particularly important in cognitive dissonance in trading. A trader may blame the market, volatility, an algorithm, a news headline, an execution platform, or another external factor for a loss. Any of those things may genuinely have contributed. But they can also become convenient explanations that prevent the trader from asking whether preparation, risk management, patience, or execution played a role.
The opposite mistake is equally possible. Traders can over-personalize an outcome and assume every loss is evidence of personal inadequacy when the trade was actually executed correctly and simply did not work.
The objective is not to blame ourselves more often.
It is to become more accurate.
Cognitive Dissonance in Trading
Trading creates an especially fertile environment for cognitive dissonance because decisions are made under uncertainty, outcomes are emotionally meaningful, and feedback is immediate.
Imagine a trader whose plan requires exiting a position at a predetermined stop. Price reaches the stop, but the trader decides not to exit. Perhaps they tell themselves the market is “just shaking people out” or that the stock has strong support nearby.
A few minutes later, price continues falling.
Now the trader faces two uncomfortable realities. The position is losing money, and the trader knowingly violated the plan.
That creates powerful dissonance.
One way to resolve it is to exit, acknowledge the violation, and examine what happened. Another is to construct an explanation that makes staying in the position feel reasonable.
“The market makers are running the stops.”
“The stock is oversold.”
“I’m trading the larger time frame now.”
“It’ll come back.”
Any one of those statements could theoretically be true. But the important question is whether the explanation emerged from new evidence or from the emotional need to justify a decision already made.
This is one of the reasons cognitive dissonance in trading can be so difficult to recognize from the inside. A rationalization does not usually feel like a rationalization. It feels like reasoning.
The MPM Perspective
One of the central ideas in the Manz Performance Model is that accurate development requires accurate attribution.
Before we can improve a performance, we have to understand what actually produced it. Was the problem psychological? Did we lack information? Was the process itself flawed? Did technology or equipment fail? Was the outcome simply influenced by uncertainty?
If we make the wrong attribution, we are likely to prescribe the wrong solution.
Cognitive dissonance interferes with that diagnostic process because it encourages us to protect our identity before examining the evidence. If acknowledging an error threatens the way we see ourselves, we become more motivated to find an explanation that makes the behavior seem reasonable.
This is why review within MPM is not meant to be an exercise in blame. Blame often makes dissonance worse because it increases the threat to identity.
Instead, the objective is curiosity.
Rather than asking:
Who is at fault?
ask:
What is the most accurate explanation for what happened?
That subtle shift is enormously important. It allows a performer to acknowledge an error without turning the error into an identity statement.
“I made an undisciplined decision” is very different from “I am an undisciplined person.”
The first provides information.
The second creates a threat.
When review feels less threatening, honest learning becomes easier.
Accurate Attribution Instead of Comfortable Attribution
This is where cognitive dissonance connects directly to attribution theory, another important piece of the Mental Insight framework.
After an outcome, our minds naturally ask:
Why did this happen?
The answer we choose matters because it determines what we do next.
Suppose a trader misses an entry and immediately thinks, “I always hesitate.”
That explanation places the problem inside the individual. But what if the actual reason was a delayed data feed or a frozen execution platform?
The attribution is wrong, and therefore the intervention will be wrong.
Now imagine the opposite. The trader says, “My platform was slow,” when the platform worked perfectly and the real problem was fear.
Again, the attribution is wrong.
The goal is neither relentless self-criticism nor relentless externalization. The goal is accurate attribution.
Understanding cognitive dissonance in trading helps us recognize why accurate attribution can be difficult. We are not simply analyzing causes. We are also protecting an identity while we do it.
That is why curiosity is such an important performance skill.
Putting It Into Practice
The next time something goes wrong, try resisting the urge to explain it immediately.
Give yourself a little distance before deciding why it happened. Begin with the facts. What actually occurred? What did you know at the time? What did you do? What happened afterward?
Then examine your explanation. What evidence supports it? What evidence contradicts it? What part of the situation was under your control, and what part was not? Is there another explanation that fits the facts equally well—or better?
One particularly useful question is:
If I were coaching someone else in exactly this situation, what would I tell them?
We often become more objective when our identity is no longer the thing being evaluated.
Another useful question is:
What explanation would I consider if I did not need to defend myself?
That can be uncomfortable.
It can also be incredibly revealing.
The Hidden Force
Cognitive dissonance encourages us to protect our identity by changing our explanation rather than our behavior. Growth begins when curiosity becomes more important than being right.
The hidden danger is not simply that we make mistakes. Everyone makes mistakes. The danger is that we become so good at explaining them that the behavior never has to change.
This is why cognitive dissonance in trading can quietly slow development for years. The trader continues experiencing the same problem, but each new occurrence receives a different explanation.
Eventually, the explanations become more sophisticated while the behavior remains remarkably similar.
One Thing to Think About
The greatest obstacle to improvement is not making mistakes.
It is protecting ourselves from learning why we made them.
Think about a recent situation in which you immediately knew why something went wrong. Now ask yourself a slightly uncomfortable question:
How certain am I that my explanation is actually true?
Sometimes the answer will remain exactly the same.
Other times, you may discover that what felt like certainty was really self-protection.
Performance Challenge
For the next seven days, pay attention to moments when you hear yourself thinking or saying phrases such as “Yeah, but…,” “The real reason was…,” “Normally I would have…,” or “If only…”
These phrases are not automatically signs of rationalization. Sometimes they introduce important context. But they can also signal that the mind is trying to reduce discomfort.
When you notice one, pause before continuing the explanation and ask:
Is this helping me understand what happened, or is it helping me feel better about what happened?
Sometimes the answer will be both.
But not always.
At the end of the week, look for recurring themes. Do you tend to blame yourself too quickly? Do you tend to blame circumstances? Are there particular behaviors you repeatedly defend? Are there certain situations in which your explanations become especially elaborate?
The goal is not to catch yourself doing something wrong.
The goal is to become more aware of how your mind protects you—and whether that protection is helping or interfering with development.
Julie’s Book Corner
Mistakes Were Made (But Not by Me)
Carol Tavris and Elliot Aronson
Few books make cognitive dissonance as accessible and relevant to everyday life as Mistakes Were Made (But Not by Me). Tavris and Aronson explore self-justification, belief perseverance, and the remarkable ways intelligent people can defend decisions even when new evidence suggests that those decisions should be reconsidered.
For anyone interested in understanding why people sometimes double down instead of changing course, it is an excellent companion to this Mental Insight topic.
Julie’s Toolbox
One of the most useful tools for reducing self-deception is a simple structured reflection journal. The goal is not to record every thought you had during the day. It is to create enough separation between facts and interpretation that you can examine your explanation rather than automatically accepting it.
After an important performance, divide your reflection into four areas: Facts, My Interpretation, Alternative Explanations, and What I’ll Test Next Time.
Begin by recording only what you know happened. Then write down your initial explanation. After that, force yourself to generate at least one plausible alternative explanation, even if you do not ultimately believe it. Finally, identify something you can observe or test during the next performance.
This simple structure is particularly useful for recognizing cognitive dissonance in trading, because it makes it harder to confuse an emotionally satisfying explanation with an established fact.
As an Amazon Associate, we may earn from qualifying purchases. These recommendations include products we genuinely use, value, or believe may benefit our readers. Thank you for supporting our work.
Final Thought
One of the great ironies of human performance is that the mind sometimes protects confidence by protecting mistakes.
That protection makes sense. No one enjoys discovering that a decision was poor, a belief was mistaken, or a behavior was inconsistent with the person they want to be.
But protecting ourselves from that discomfort can also protect the very behavior that is holding us back.
The performers who improve most rapidly are not necessarily those who make the fewest errors. They are the ones who become increasingly willing to look at their errors without allowing those errors to define them.
Excellence does not require perfection.
It requires the ability to exchange a comforting explanation for a more accurate one—and then use what you learn to perform differently the next time.
AI Stock Market Correction
AI Can Win and AI Stocks Can Still Crash: The Valuation Risk Traders Are Missing
There is an assumption buried inside much of the artificial intelligence trade that I think traders need to reconsider.
It goes something like this:
If AI really does transform the economy, the stocks leading the AI revolution should continue moving higher.
That sounds logical.
But it isn’t necessarily true.
A group of European Central Bank economists has raised a fascinating possibility: a significant AI stock market correction may eventually occur even if artificial intelligence lives up to the extraordinary expectations investors currently have for it.
In other words, Nvidia does not have to fail for NVDA to fall.
Microsoft does not have to lose money on artificial intelligence for MSFT to correct.
AI does not have to be a bubble for technology valuations to come down.
The technology can be enormously successful while the stocks associated with it still experience a painful repricing.
That distinction may be one of the most important things investors and traders understand about the next stage of the AI boom.

The ECB Is Not Saying AI Is a Fraud
The ECB economists’ argument is more sophisticated than the familiar comparison between today’s artificial intelligence boom and the dot-com bubble.
In fact, they specifically argue that a correction in technology valuations should not automatically be interpreted as evidence that investors were irrational.
Looking at previous technological revolutions, the researchers conclude that a correction in today’s elevated valuations is likely even if those valuations were rational when investors initially established them. ([European Central Bank](https://www.ecb.europa.eu/press/blog/date/2026/html/ecb.blog20260817~754a8a4418.en.html?utm_source=chatgpt.com))
That is an important distinction.
Artificial intelligence can be genuinely transformative.
AI companies can generate tremendous revenue.
Productivity can improve.
Entire industries can be reorganized around the technology.
And some of today’s leading AI stocks can still decline sharply.
To understand why, we need to separate the value of the technology from the valuation of the stock.
A Great Company Can Still Be an Expensive Stock
This is one of the most basic principles of investing, but it is remarkably easy to forget during powerful bull markets.
A company can perform spectacularly while its stock performs poorly.
Why?
Because the price investors are willing to pay for those future earnings can change.
Imagine a company earns $10 per share and investors are willing to pay 40 times earnings for it.
The stock would theoretically trade at $400.
Now suppose earnings grow 20% to $12 per share.
That is fantastic operational performance.
But if investors decide the appropriate valuation is now only 25 times earnings, the stock is worth:
$12 × 25 = $300.
Earnings increased 20%.
The stock fell 25%.
Nothing went wrong with the business.
The multiple changed.
That is the valuation risk facing the artificial intelligence trade.
The Option Value of Nvidia
The ECB economists use an idea that is particularly useful for understanding what has happened to stocks such as Nvidia (NVDA).
Think about Nvidia several years ago.
Investors knew artificial intelligence might become enormously important.
But nobody knew exactly how important.
There was a wide range of possible outcomes.
At one extreme, AI adoption could have disappointed and Nvidia’s enormous investment in accelerated computing might never have produced the revenue investors expected.
At the other extreme, Nvidia could become the central computing platform for one of the largest technological transformations in history.
That extreme upside potential has value.
Economists describe it as option value.
The ECB’s researchers argue that uncertainty surrounding an emerging breakthrough can actually justify very high valuations for pioneering companies because investors are purchasing exposure to potentially extraordinary outcomes. ([European Central Bank](https://www.ecb.europa.eu/press/blog/date/2026/html/ecb.blog20260817~754a8a4418.en.html?utm_source=chatgpt.com))
That helps explain why investors may rationally pay exceptionally high multiples for early technological leaders.
But Something Changes When the Technology Succeeds
Here is the counterintuitive part.
Suppose artificial intelligence succeeds.
Not partially.
Completely.
AI spreads through banking, healthcare, manufacturing, logistics, advertising, software, transportation, defense, education and virtually every other major industry.
At that point, AI is no longer simply an opportunity belonging to a handful of companies.
It becomes part of the economy itself.
And according to the ECB researchers, that changes the nature of the risk.
During the early stage, the uncertainty is concentrated in individual companies.
Will Nvidia win?
Will Microsoft win?
Will OpenAI succeed?
Will another architecture replace today’s technology?
But once AI becomes deeply embedded throughout the economy, a disruption involving the technology could affect virtually everyone.
Company-specific risk becomes increasingly systemic risk.
AI Success Can Actually Increase the Risk Premium
This is the heart of the ECB argument.
As artificial intelligence becomes more important to the entire economy, investors may require greater compensation for owning stocks exposed to that economy-wide risk.
Economists call that compensation the equity risk premium.
And when the required return investors demand from stocks increases, valuations generally decline.
That creates a seemingly strange sequence:
AI succeeds → AI spreads throughout the economy → systemic exposure to AI increases → investors demand a larger risk premium → valuation multiples compress.
The technology succeeds.
Profits can rise.
Productivity can increase.
Yet stock prices can still fall because investors are no longer willing to pay the same multiple for those earnings.
We Have Seen This Movie Before
The ECB economists compared artificial intelligence with several previous technological revolutions, including:
- Railroads in the 19th century
- Electrification
- Radio in the 1920s
- The internet during the dot-com era
These technologies were not imaginary.
They changed the world.
Railroads transformed transportation and commerce.
Electricity transformed almost every industry.
Radio transformed mass communication.
The internet became one of the foundational technologies of the modern economy.
And yet stocks associated with those innovations experienced enormous booms and painful corrections along the way.
The ECB researchers note that transformative technologies have historically attracted investment and driven valuations sharply higher before those valuations eventually declined. ([European Central Bank](https://www.ecb.europa.eu/press/blog/date/2026/html/ecb.blog20260817~754a8a4418.en.html?utm_source=chatgpt.com))
The lesson isn’t that new technologies fail.
The lesson is that technological success does not guarantee continuously rising stock valuations.
The Internet Is Probably the Best Comparison
Think about the internet in 1999.
Investors were absolutely correct about the technology.
The internet did transform business.
It transformed communication.
It transformed shopping.
It transformed entertainment.
It transformed advertising.
It created some of the largest companies in history.
The technology wasn’t the mistake.
The mistake was assuming that every price investors were willing to pay for internet exposure could be justified by the eventual economics.
That is the distinction traders need to remember today.
Artificial intelligence may prove every bit as transformative as its strongest advocates believe.
That does not tell us what multiple investors should pay for AI earnings today.
Why Nvidia Can Keep Growing and NVDA Can Still Correct
Let’s bring this directly back to Nvidia.
Nvidia could continue selling extraordinary numbers of GPUs.
Data-center revenue could continue growing.
New generations of Nvidia processors could remain dominant.
OpenAI, Microsoft, Meta, Amazon, Google and other customers could continue building enormous AI infrastructure projects.
And NVDA could still experience a substantial correction.
That would not necessarily invalidate the Nvidia story.
It could simply mean investors were willing to pay less for each dollar of future Nvidia earnings.
This is why traders should watch both:
earnings growth
and
valuation multiples.
They are not the same thing.
The Bond Market Makes This Even More Important
This argument becomes even more compelling when we connect it to what is currently happening in the bond market.
Long-term government yields have been rising as investors confront persistent inflation, enormous fiscal deficits, heavy government borrowing and rapidly increasing corporate debt issuance associated with the artificial intelligence infrastructure boom.
This matters because interest rates influence the discount rate investors use to value future earnings.
Higher long-term yields mean future corporate profits are worth less in present-value terms.
That disproportionately affects companies whose valuations depend on earnings expected many years into the future.
In other words, many technology companies are effectively long-duration assets.
The combination of rising Treasury yields and elevated AI valuations therefore creates a particularly important risk.
The AI Boom May Be Creating Its Own Headwind
This brings together the three major themes we have been following recently at TraderInsight.
First, artificial intelligence companies require enormous amounts of infrastructure.
Second, companies such as Nvidia are beginning to help finance that infrastructure.
Third, those investments are contributing to unprecedented demand for capital at the same time governments are issuing enormous quantities of debt.
That creates a fascinating feedback loop:
AI demand grows → AI infrastructure spending grows → borrowing grows → long-term capital becomes more expensive → discount rates rise → AI valuation multiples come under pressure.
That does not mean AI growth stops.
In fact, the opposite may be happening.
The industry may be growing so rapidly that financing that growth itself begins affecting asset valuations.
Why Europe Is Worried About American Technology Stocks
The ECB’s concern goes well beyond whether NVDA or QQQ experiences a correction.
American technology stocks have become deeply embedded in European household and institutional portfolios.
Euro-area investors have built substantial exposure to U.S. equities through investment funds, pension products and insurers. The ECB has repeatedly highlighted the increasing importance of U.S. technology and AI-related stocks to European financial portfolios. ([European Central Bank](https://www.ecb.europa.eu/press/financial-stability-publications/fsr/html/ecb.fsr202605~50566915a7.en.html?utm_source=chatgpt.com))
That means a sharp technology selloff in the United States would not remain neatly contained inside American brokerage accounts.
European investment funds could experience losses.
Pension assets could decline.
Insurers could see investment portfolios fall.
Risk appetite could deteriorate.
And because U.S. and European equity markets often move together during periods of stress, falling American technology stocks could quickly become a broader global financial event.
Market Concentration Adds Another Layer of Risk
There is also the issue of concentration.
The Magnificent Seven—Alphabet, Amazon, Apple, Meta, Microsoft, Nvidia and Tesla—have become an extraordinarily important component of U.S. equity-market performance.
ECB analysis earlier this year noted that the Magnificent Seven accounted for roughly 40% of the S&P 500’s market capitalization. ([European Central Bank](https://www.ecb.europa.eu/press/key/date/2026/html/ecb.sp260323_1~1e06784a89.en.html?utm_source=chatgpt.com))
That creates a structural vulnerability.
When a small group of very large companies drives a disproportionate amount of index performance, weakness in those stocks can pull down an otherwise healthy market.
Index investors may believe they own a broadly diversified portfolio while actually carrying substantial exposure to a relatively small collection of mega-cap technology companies.
That concentration becomes particularly important if institutional investors begin reducing exposure simultaneously.
Stocks Traders Should Watch
If this valuation-reset thesis begins playing out, I would concentrate on the stocks carrying the greatest influence over AI sentiment and major indexes.
- Nvidia (NVDA)
- Microsoft (MSFT)
- Meta Platforms (META)
- Amazon (AMZN)
- Alphabet (GOOGL)
- Broadcom (AVGO)
- Oracle (ORCL)
- Apple (AAPL)
The important signal would not simply be whether these stocks decline.
Corrections happen all the time.
The more meaningful signal would be a persistent change in how investors respond to good news.
Watch How Stocks React to Good News
This is one of my favorite ways to judge changes in institutional sentiment.
During a strong bull market, good news tends to produce strong upside reactions.
Earnings beat expectations.
The stock gaps higher and holds the move.
A company announces another AI partnership.
Buyers chase it.
Revenue guidance increases.
The stock expands its valuation multiple.
But mature market cycles often begin behaving differently.
A company reports excellent earnings—and the stock barely moves.
Revenue beats expectations—and sellers appear.
Another massive AI spending announcement is made—and investors begin asking about return on capital instead of celebrating the size of the investment.
That change in reaction is important.
When good news stops producing good price action, pay attention.
Nvidia May Be the Most Important Tell
NVDA remains one of the best sentiment indicators for the entire artificial intelligence trade.
There are several things I would watch closely:
- NVDA relative strength versus QQQ
- Price reaction following earnings beats
- Institutional response to large AI infrastructure commitments
- Whether previous support levels continue attracting buyers
- Volume accompanying breakdowns
- Whether rallies recover quickly or begin failing below prior highs
If Nvidia continues producing spectacular operating results but the stock begins persistently underperforming, that could be an early indication that the market is changing the multiple it is willing to assign to AI growth.
QQQ May Matter More Than Any Single Stock
The Invesco QQQ Trust (QQQ) gives traders a broader view of mega-cap growth appetite.
In a normal pullback, individual leaders may correct while QQQ holds major support and institutional buyers rotate among technology stocks.
A more meaningful valuation reset would look different.
We would expect to see:
- Multiple mega-cap leaders weakening simultaneously
- QQQ losing important support
- Failed rallies rather than immediate dip buying
- Declining market breadth
- Persistent weakness even following favorable earnings
That would suggest investors are not simply rotating between technology leaders.
They may be reducing the valuation premium assigned to the entire group.
Don’t Ignore TLT and Treasury Yields
For traders following AI stocks, I would continue keeping the bond market on the screen.
The iShares 20+ Year Treasury Bond ETF (TLT) provides a convenient way to monitor long-duration Treasury prices.
When TLT falls, long-term yields are generally rising.
That means one particularly dangerous combination would be:
- TLT breaking support
- 30-year Treasury yields making new highs
- QQQ losing support
- NVDA underperforming QQQ
- Other Magnificent Seven stocks failing to respond to positive news
That combination would suggest that rising discount rates and valuation compression are beginning to reinforce one another.
There Is Also a Bullish Scenario
None of this means traders should automatically become bearish on artificial intelligence.
The most constructive environment would be one in which earnings continue growing while valuation excess gradually comes out of the market.
A correction can actually create healthier conditions.
If AI stocks decline while corporate fundamentals remain strong, valuations become more attractive.
Companies with genuine competitive advantages can then separate themselves from companies that simply benefited from AI enthusiasm.
That would create exactly the type of environment professional traders want:
dispersion.
The strongest companies begin outperforming the weaker ones.
And stock selection becomes more important than simply owning everything associated with artificial intelligence.
The Next Phase May Be About Return on Investment
For several years, investors rewarded companies for spending more on AI.
$20 billion sounded exciting.
Then $50 billion.
Then $100 billion.
Now infrastructure commitments are measured in hundreds of billions of dollars.
Eventually, investors are going to ask the obvious question:
What return are you earning on all of this money?
That could be the defining question of the next stage of the artificial intelligence investment cycle.
Companies able to convert enormous capital expenditures into equally enormous cash flow may continue commanding premium valuations.
Companies that cannot may experience substantial multiple compression.
The words “AI investment” alone may stop being sufficient.
The Five Charts I Would Watch
If I wanted to monitor the possibility of an AI stock market correction, I would keep five charts readily available:
- NVDA — the primary sentiment barometer for AI infrastructure.
- QQQ — the broader mega-cap technology trend.
- 30-year Treasury yield — the market price of long-duration capital.
- TLT — confirmation from long-term Treasury prices.
- Equal-weight S&P 500 versus the cap-weighted S&P 500 — a useful measure of whether market leadership is broadening or becoming increasingly dependent on mega-cap technology.
I would be particularly interested in divergences among them.
If the S&P 500 remains near highs while NVDA, QQQ and other AI leaders begin weakening beneath the surface, that could provide an early warning before weakness becomes obvious in the headline indexes.
TraderInsight Trading Implications
The ECB’s research creates several practical lessons for traders.
- Do not confuse a great technology with a great entry price. Artificial intelligence can transform the world while individual AI stocks remain overpriced.
- Watch multiples as well as earnings. Rising profits do not guarantee rising stock prices when valuation multiples are contracting.
- Pay attention to reactions to good news. Strong fundamentals combined with weak price reactions can signal that institutional sentiment is changing.
- Monitor Treasury yields. Higher long-term rates increase discount rates and can accelerate valuation compression in high-growth stocks.
- Watch relative strength. The AI stocks that continue outperforming during a broad correction may become the leaders of the next advance.
- Expect increasing differentiation. As the AI boom matures, balance-sheet strength, cash generation and return on invested capital should matter more.
- Remember global contagion. U.S. mega-cap technology stocks have become important holdings throughout the global financial system, so a serious AI selloff may not remain confined to Nasdaq.
The Most Important Distinction
There are really two separate questions traders need to ask about artificial intelligence.
Question one:
Will artificial intelligence transform the global economy?
I think the evidence increasingly suggests that it will.
But then comes question two:
What price should investors pay today for companies expected to benefit from that transformation?
Those are completely different questions.
You can be extraordinarily bullish about artificial intelligence while simultaneously believing some AI stocks are too expensive.
You can believe Nvidia will remain one of the dominant companies of the next decade while recognizing that NVDA can experience 20%, 30% or larger corrections along the way.
And you can believe AI will create enormous economic value without believing today’s valuation multiples will remain permanently elevated.
TraderInsight Bottom Line
The most interesting part of the ECB’s warning is not that artificial intelligence could fail.
It is that artificial intelligence could succeed.
That success itself changes the nature of the investment.
As AI moves from an emerging technology into critical economic infrastructure, the extraordinary uncertainty that helped justify enormous upside valuations begins to disappear.
At the same time, AI becomes increasingly intertwined with the entire economy, potentially increasing systemic risk and the return investors demand for holding equities.
Add rising long-term interest rates, enormous infrastructure financing requirements and historically concentrated equity indexes, and the conditions for an AI stock market correction begin to make considerably more sense.
The takeaway for traders is straightforward.
Don’t ask only whether AI is going to work.
Ask what the market has already priced in.
Ask what investors are willing to pay for those earnings.
Ask whether good news is still producing good price action.
And watch the bond market as closely as you watch Nvidia.
Because the next major correction in AI stocks may not happen because the technology failed.
It may happen precisely while the technology is succeeding.
TraderInsight educational content is provided for informational and educational purposes only and is not investment advice. Trading involves substantial risk, and past performance does not guarantee future results.
Nvidia OpenAI Data Center Financing
Nvidia’s $105 Billion AI Bet: When Chip Demand Becomes Infrastructure Finance
Nvidia has spent the artificial intelligence boom selling the picks and shovels.
Now it is helping finance the mine.
That distinction may turn out to be one of the most important developments in the next phase of the AI investment cycle.
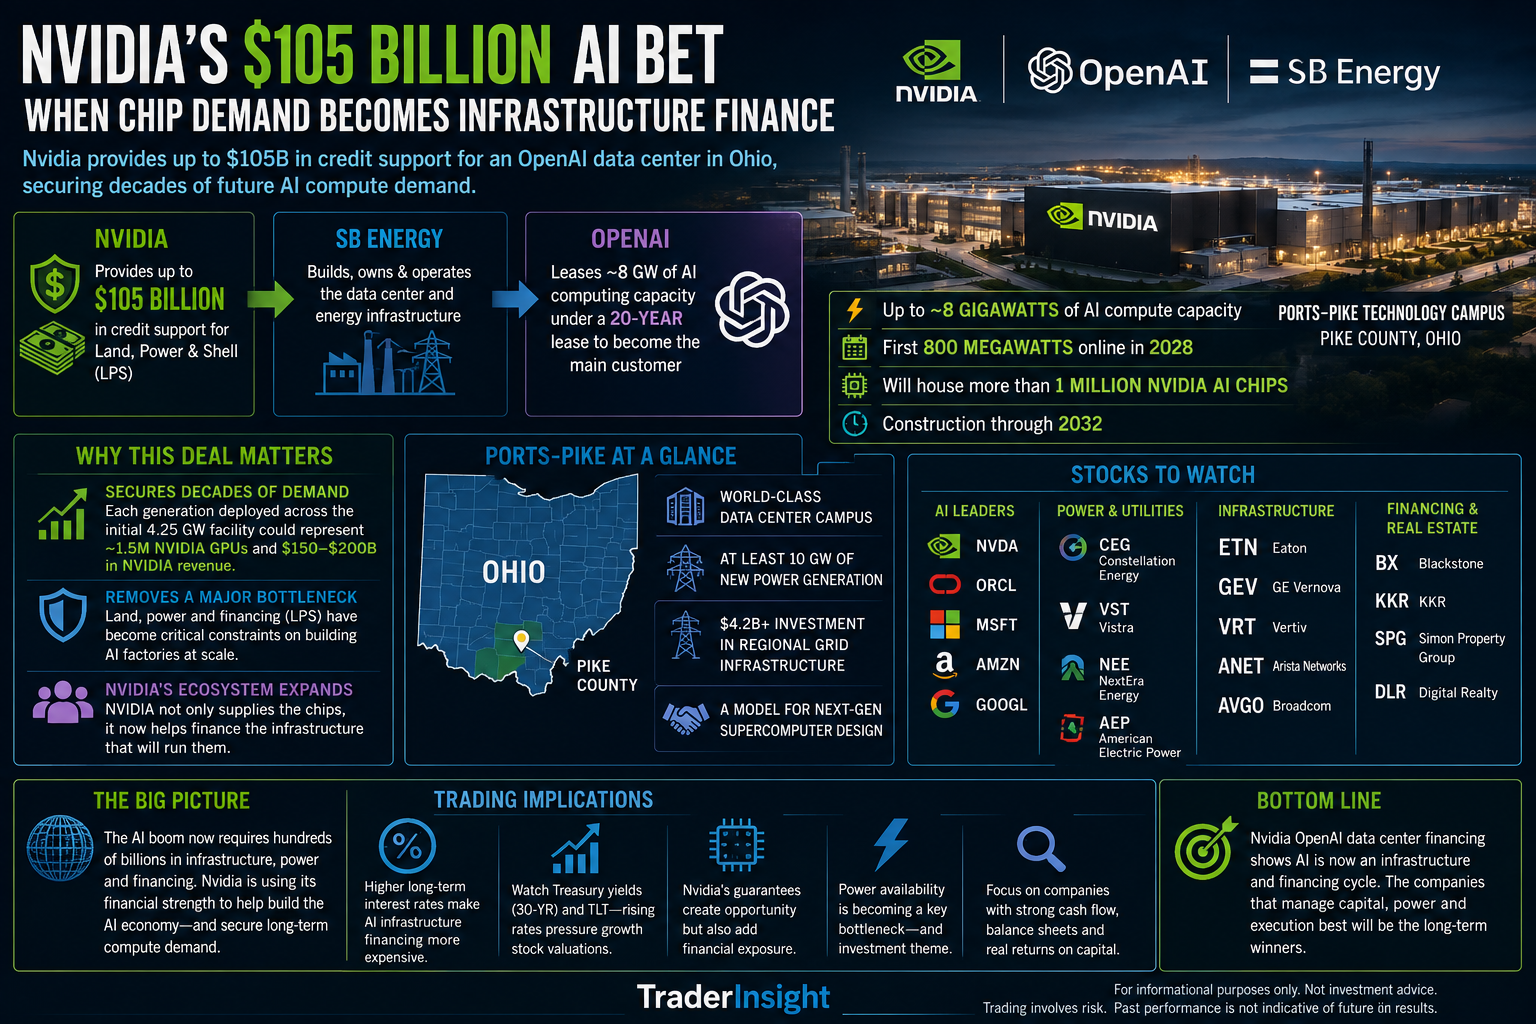
Nvidia has agreed to provide as much as $105 billion in credit support for an enormous OpenAI data-center development in Pike County, Ohio. The company is also investing $1.5 billion in SB Energy, the SoftBank-backed energy and infrastructure developer that will build, own and operate the facility. OpenAI will become the primary tenant under a 20-year lease. ([NVIDIA Newsroom](https://nvidianews.nvidia.com/news/nvidia-guarantees-sb-energy-s-ports-pike-technology-campus-in-ohio-to-exclusively-host-nvidia-ai-compute?utm_source=chatgpt.com))
The numbers are extraordinary.
OpenAI intends to secure approximately 8 gigawatts of AI computing capacity at the PORTS-Pike Technology Campus. The first deployment is expected to begin coming online in 2028, and construction could continue through 2032. Nvidia will be the exclusive AI compute infrastructure provider at the campus. ([OpenAI](https://openai.com/index/openai-joins-ports-pike-project/?utm_source=chatgpt.com))
But the size of the project is only part of the story.
The bigger development is that Nvidia is beginning to use its enormous balance sheet to help create the infrastructure necessary for customers to continue buying Nvidia hardware.
That makes Nvidia OpenAI data center financing much more than another AI headline.
It represents a fundamental evolution in the economics of the AI boom.
AI Is Becoming an Infrastructure Business
During the first stage of the artificial intelligence boom, computing power was the primary constraint.
Everybody wanted Nvidia GPUs.
Then the constraint began moving outward.
Companies needed networking equipment. They needed cooling systems. They needed data centers. Then they needed electricity.
Now they need something even more basic:
Land, power and financing.
Nvidia calls this combination LPS—land, power and shell.
And Jensen Huang is making the argument that these resources have become strategic inputs in much the same way semiconductor manufacturing capacity has been a strategic resource for Nvidia in the past.
Nvidia says that large cloud providers and investment-grade corporations can generally finance their own infrastructure. Frontier AI laboratories are different. They may have enormous demand and rapidly growing revenue, but their infrastructure requirements are expanding faster than their balance sheets and long-term credit profiles. ([NVIDIA Blog](https://blogs.nvidia.com/blog/securing-the-infrastructure-of-intelligence/?utm_source=chatgpt.com))
That creates an unusual situation.
OpenAI can potentially consume extraordinary quantities of Nvidia hardware.
But somebody has to finance the massive buildings, electricity infrastructure and long-term leases required to install that hardware.
Nvidia has decided it has a financial interest in helping solve that problem.
What Nvidia Is Actually Guaranteeing
The $105 billion headline sounds as though Nvidia is simply writing OpenAI a $105 billion check.
That is not what is happening.
Nvidia says its support covers defined portions of the project’s lease and power obligations, along with a residual-value commitment for the underlying infrastructure. The guarantee does not represent the entire construction cost or all of OpenAI’s obligations. ([NVIDIA Blog](https://blogs.nvidia.com/blog/securing-the-infrastructure-of-intelligence/?utm_source=chatgpt.com))
The initial Nvidia commitment supports approximately 4.25 gigawatts of infrastructure, and Nvidia has an option associated with the remaining 3.75 gigawatts. ([NVIDIA Newsroom](https://nvidianews.nvidia.com/news/nvidia-guarantees-sb-energy-s-ports-pike-technology-campus-in-ohio-to-exclusively-host-nvidia-ai-compute?utm_source=chatgpt.com))
The guarantee also becomes effective in stages as portions of the data center enter service between 2028 and 2030. Nvidia says its remaining exposure should decline as OpenAI makes lease payments and capacity comes online. ([NVIDIA Blog](https://blogs.nvidia.com/blog/securing-the-infrastructure-of-intelligence/?utm_source=chatgpt.com))
This is an important distinction for investors.
It is still a massive financial commitment.
But it is more accurately viewed as Nvidia using its credit strength to make an infrastructure project financeable than Nvidia directly funding the entire campus.
Why Would Nvidia Take This Risk?
Because the potential payoff is enormous.
The Ohio facility will exclusively host Nvidia AI computing infrastructure.
And Nvidia estimates that each generation of systems deployed across the initial 4.25-gigawatt facility could represent roughly 1.5 million Nvidia GPUs and approximately $150 billion to $200 billion in Nvidia revenue. ([NVIDIA Blog](https://blogs.nvidia.com/blog/securing-the-infrastructure-of-intelligence/?utm_source=chatgpt.com))
Think about that relationship.
Nvidia provides credit support that helps the data center get built.
The data center then becomes a long-lived home for Nvidia hardware.
And the hardware inside that facility can potentially be replaced multiple times over a 20-year lease as new generations of Nvidia processors become available.
That may be the most important part of the entire deal.
Nvidia isn’t simply trying to sell one generation of chips into one giant data center.
It is trying to secure 20 years of real estate and power where multiple generations of Nvidia hardware can operate.
The $600 Billion Number
The scale becomes even clearer when we look beyond Ohio.
Nvidia says OpenAI’s existing and planned deployments represent approximately 12 gigawatts of Nvidia computing infrastructure, with the potential to reach roughly 16 gigawatts if the additional PORTS-Pike capacity is exercised.
Nvidia estimates that opportunity could represent roughly $600 billion of Nvidia compute through 2030. ([NVIDIA Blog](https://blogs.nvidia.com/blog/securing-the-infrastructure-of-intelligence/?utm_source=chatgpt.com))
That explains why Nvidia is willing to think differently about infrastructure finance.
If helping finance land and electricity unlocks hundreds of billions of dollars in potential future product sales, providing credit support may make economic sense.
But it also changes the risk profile of the company.
Is This Circular Financing?
This is the question investors are increasingly asking.
The AI ecosystem has developed an unusual web of relationships.
Chipmakers invest in AI companies.
AI companies commit to buying chips.
Cloud companies invest in AI developers.
AI developers purchase computing capacity from those same cloud providers.
Infrastructure developers borrow money to build data centers.
And now Nvidia is using its financial strength to help support infrastructure that will ultimately be filled with Nvidia products.
Critics describe this as circular financing.
Nvidia strongly disagrees.
The company’s argument is straightforward: OpenAI is responsible for paying the lease, while Nvidia is using its balance sheet to secure a scarce strategic resource—land and power—where its products can be deployed for decades. ([NVIDIA Blog](https://blogs.nvidia.com/blog/securing-the-infrastructure-of-intelligence/?utm_source=chatgpt.com))
I think traders should recognize that both arguments contain something worth watching.
This is not necessarily circular financing in the simplistic sense that Nvidia is handing customers money and immediately booking it as revenue.
But the relationship between Nvidia’s financial commitments and future demand for Nvidia products is undeniably becoming more intertwined.
That makes the quality of AI demand increasingly important.
The Question Is No Longer Just Demand
For years, the bullish Nvidia thesis could largely be summarized with one question:
How many GPUs does the world want?
We may be entering a phase where investors need to ask a second question:
Who is financing all of those GPUs?
That is a very different investment question.
If customers generate sufficient revenue and cash flow to support the infrastructure being built, Nvidia’s strategy could be extraordinarily powerful.
The company will have helped remove one of the biggest bottlenecks limiting AI deployment while simultaneously securing enormous future demand for its own products.
But if AI monetization disappoints, financial commitments that look strategic during a boom could look considerably less attractive during a slowdown.
Nvidia Is Building an AI Financing Ecosystem
The Ohio project does not exist in isolation.
Nvidia recently announced partnerships with major financial institutions including BlackRock, Blackstone, Brookfield, Goldman Sachs, KKR and Apollo to establish AI infrastructure financing platforms designed to mobilize more than $500 billion of third-party capital. ([NVIDIA Newsroom](https://nvidianews.nvidia.com/?utm_source=chatgpt.com))
That tells us something important about where Jensen Huang believes the bottleneck is moving.
The problem is no longer simply producing enough GPUs.
The industry now needs enough capital to build the factories in which those GPUs will operate.
That means Nvidia increasingly sits at the intersection of:
- Semiconductors
- Artificial intelligence
- Commercial real estate
- Energy generation
- Electrical-grid infrastructure
- Project finance
- Corporate credit
- Capital markets
That is a much larger economic ecosystem than the semiconductor industry alone.
The Connection to Rising Bond Yields
This also ties directly into another theme we have been discussing at TraderInsight.
The AI infrastructure boom requires extraordinary amounts of capital at exactly the same time governments around the world are issuing enormous quantities of debt.
Corporations need money.
Governments need money.
Utilities need money.
Data-center operators need money.
AI laboratories need money.
And all of them are competing for investor capital.
That helps explain why the relationship between AI infrastructure spending and long-term interest rates deserves much more attention from equity traders.
The AI boom can produce spectacular corporate growth while simultaneously contributing to an environment in which the price of long-term capital rises.
Nvidia: The Bull Case
There is a powerful bullish interpretation of this deal for Nvidia (NVDA).
Nvidia is effectively using the strength of its balance sheet and dominant competitive position to secure future demand.
The Ohio campus could support generations of Nvidia hardware rather than one equipment cycle.
If AI inference demand grows the way Nvidia and OpenAI expect, securing power and real estate today could prove extremely valuable.
It could also make Nvidia increasingly difficult to displace.
A competitor would no longer simply need to produce a faster chip.
It would need to compete against an ecosystem in which Nvidia is integrated into the processors, networking, software, data-center architecture and financing structure.
That is an extraordinarily deep moat if the economics work.
Nvidia: The Bear Case
But traders should not dismiss the other side.
The more Nvidia financially supports the infrastructure surrounding its customers, the more risk migrates onto Nvidia’s balance sheet.
That creates several potential concerns:
- Customer concentration
- Counterparty risk
- Long-term lease exposure
- Residual-value risk
- Infrastructure overbuilding
- Potential pressure on future cash flow
- Greater sensitivity to AI demand assumptions
There is also a fundamental question investors cannot answer yet:
Will the economic value ultimately created by AI justify the enormous amount of infrastructure being constructed?
If the answer is yes, today’s numbers could eventually look surprisingly reasonable.
If the answer is no, the industry could discover that it built too much capacity at too high a price.
OpenAI Becomes Even More Important to Nvidia
The relationship also makes OpenAI increasingly important to Nvidia shareholders.
OpenAI is not merely another GPU customer in this arrangement.
It is the principal tenant supporting an enormous long-duration infrastructure development.
OpenAI therefore needs to continue converting extraordinary demand for ChatGPT and its AI services into revenue capable of supporting equally extraordinary infrastructure commitments.
If it succeeds, Nvidia could benefit tremendously.
If OpenAI’s growth slows materially, however, investors may begin scrutinizing the financial relationships much more aggressively.
That makes future disclosures about utilization, AI revenue growth, capital expenditures and financing arrangements particularly important.
Power May Be the Real AI Bottleneck
There is another part of this story equity traders should not overlook.
The PORTS-Pike development is expected to require at least 10 gigawatts of new electricity generation to support approximately 8 gigawatts of AI computing capacity.
SB Energy and SoftBank also plan at least $4.2 billion of new regional grid infrastructure through a partnership with AEP Ohio. ([NVIDIA Newsroom](https://nvidianews.nvidia.com/news/nvidia-guarantees-sb-energy-s-ports-pike-technology-campus-in-ohio-to-exclusively-host-nvidia-ai-compute?utm_source=chatgpt.com))
This provides another reminder that AI is increasingly becoming an energy story.
The next generation of winners may not all carry an AI label.
Some may produce electricity.
Some may build transformers.
Some may manufacture switchgear.
Some may construct transmission systems.
Some may own the land and data centers.
Stocks to Watch: The AI Power Trade
The development reinforces the importance of following companies connected to electricity generation and grid infrastructure.
Names worth keeping on the radar include:
- Constellation Energy (CEG)
- Vistra (VST)
- NextEra Energy (NEE)
- American Electric Power (AEP)
- Eaton (ETN)
- GE Vernova (GEV)
The important trading question is not simply whether electricity demand will rise.
That increasingly looks obvious.
The question is which companies can convert that demand into earnings without taking on excessive financing risk.
Oracle, Microsoft, Amazon and Google
The Nvidia deal also increases the importance of watching the companies building competing AI infrastructure ecosystems.
Oracle (ORCL), Microsoft (MSFT), Amazon (AMZN) and Alphabet (GOOGL) are all investing heavily in computing capacity.
These companies have stronger established cash flows than most frontier AI laboratories, which could become increasingly important if long-term financing costs remain elevated.
As the AI infrastructure cycle matures, I expect investors to focus more heavily on the relationship between capital expenditures and the revenue generated by those investments.
Simply announcing another $50 billion or $100 billion infrastructure project may eventually stop being enough.
Markets will want to see returns.
The Infrastructure Suppliers May Be the Cleaner Trade
There may also be an interesting second-order opportunity developing.
When hundreds of billions of dollars are being spent constructing AI factories, companies supplying essential equipment can benefit regardless of which AI model ultimately wins.
That keeps stocks such as:
- Eaton (ETN) — electrical infrastructure
- Vertiv (VRT) — cooling and data-center power systems
- GE Vernova (GEV) — power-generation equipment
- Arista Networks (ANET) — high-speed networking
- Broadcom (AVGO) — networking and custom AI silicon
particularly interesting.
These companies represent the infrastructure underneath the infrastructure.
What I Would Watch in NVDA
For traders, I would separate the long-term investment story from the short-term price action.
NVDA now has two competing narratives.
The bullish narrative is:
Nvidia is locking up decades of AI infrastructure and potentially hundreds of billions of dollars of future demand.
The bearish narrative is:
Nvidia increasingly needs to use its own financial strength to support the customers purchasing its products.
Price action will tell us which argument institutions currently find more important.
I would watch:
- NVDA relative strength versus QQQ
- Reaction to new AI financing announcements
- Whether institutional buyers defend major support levels
- Volume around earnings and financing disclosures
- Free-cash-flow trends
- Changes in guarantees and other financial commitments
If NVDA continues outperforming QQQ despite growing concerns about infrastructure financing, that would tell us institutions still see the financing strategy primarily as a competitive advantage.
If NVDA begins persistently underperforming despite strong AI demand, investors may be starting to assign a greater risk premium to these commitments.
The Five Charts I Would Put on the Screen
To monitor this theme, I would keep an eye on five markets:
- NVDA — the center of the AI infrastructure ecosystem.
- QQQ — the broader technology-risk environment.
- 30-year Treasury yield — the price of long-duration capital.
- TLT — an easy visual proxy for long-term Treasury prices.
- CEG/VST/ETN/VRT — confirmation from the AI power and infrastructure complex.
The interaction among these markets may tell us much more than watching Nvidia alone.
TraderInsight Trading Implications
The most important implication of Nvidia OpenAI data center financing is that the artificial intelligence boom is entering a different phase.
The first phase was about demand for AI.
The second was about demand for GPUs.
The next phase is increasingly about financing the physical infrastructure required to turn those GPUs on.
For traders, that creates several practical takeaways:
- Watch Nvidia’s balance sheet as closely as its chip shipments. Credit support and infrastructure commitments are becoming material parts of the story.
- Watch OpenAI’s growth. OpenAI is becoming increasingly important to Nvidia’s future infrastructure economics.
- Watch Treasury yields. Higher long-term rates increase the cost of financing massive AI projects.
- Watch power companies. Electricity availability may become one of the biggest constraints on AI growth.
- Watch infrastructure suppliers. ETN, VRT, GEV, ANET and other suppliers may benefit from spending regardless of which AI model ultimately dominates.
- Watch relative strength. The companies that continue outperforming while rates rise are telling us where institutional money has the greatest conviction.
TraderInsight Bottom Line
Nvidia’s Ohio agreement represents something much larger than another enormous data-center announcement.
It shows us how the economics of artificial intelligence are changing.
Nvidia is evolving from a company that simply sells AI processors into a company helping assemble the financial and physical infrastructure required to deploy those processors at unprecedented scale.
That strategy could deepen Nvidia’s competitive moat and secure extraordinary future revenue.
But it also moves Nvidia closer to the financial risk being assumed throughout the AI ecosystem.
And that is the tension traders need to understand.
The central question is no longer whether AI demand exists.
It clearly does.
The question is whether that demand ultimately generates enough economic value to justify hundreds of billions—and potentially trillions—of dollars being committed to data centers, power generation, GPUs and financing.
If it does, Nvidia may be positioning itself at the center of one of the largest infrastructure investment cycles in history.
If it does not, the financial commitments now being made will matter every bit as much as the chips being sold.
AI has become an infrastructure story.
And increasingly, it is becoming a financing story too.
TraderInsight educational content is provided for informational and educational purposes only and is not investment advice. Trading involves substantial risk, and past performance does not guarantee future results.
AI bond issuance and Treasury yields
AI Bond Issuance and Treasury Yields: Why Rising Long-Term Rates Could Reshape the AI Trade
For most of the artificial intelligence boom, traders have focused on semiconductors, data centers, cloud computing, electricity demand and the enormous capital expenditure plans being announced by the world’s largest technology companies.
Now another piece of the AI investment cycle is beginning to matter: the bond market.
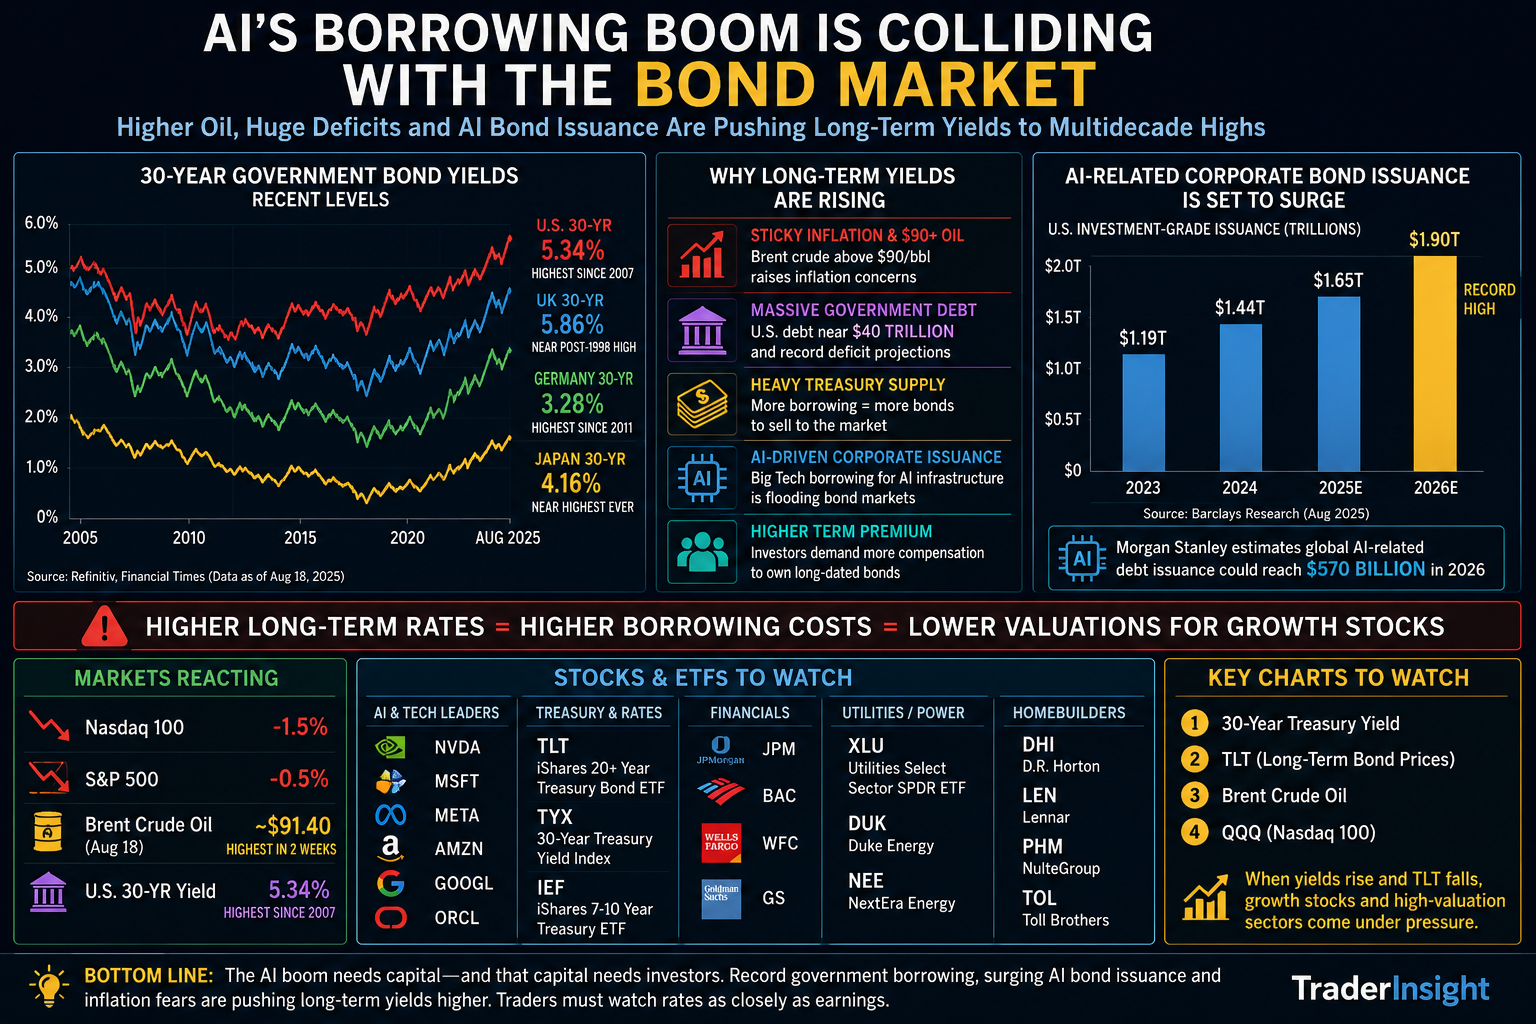
Long-term borrowing costs have climbed sharply around the world, with 30-year U.S. Treasury yields recently reaching levels not seen since before the financial crisis. Similar pressure has appeared in Germany, France, the United Kingdom and Japan.
The immediate explanation includes familiar concerns: persistent inflation, higher oil prices, enormous government deficits and growing Treasury issuance. But there is another source of supply entering the equation. Big technology companies are borrowing tremendous amounts of money to finance artificial intelligence infrastructure.
That means AI bond issuance and Treasury yields are becoming increasingly interconnected—and that relationship could have important consequences for technology stocks, financials, utilities, homebuilders and the broader equity market.
The Long End of the Bond Market Is Sending a Warning
The 30-year U.S. Treasury yield recently reached approximately 5.34%, its highest level since 2007. Long-duration government debt in Europe and Japan has also experienced substantial selling pressure.
This is important because the move is occurring at the long end of the yield curve.
Short-term interest rates are heavily influenced by expectations for central-bank policy. Long-term rates reflect something broader: expectations for future inflation, government borrowing, economic growth and the additional compensation investors demand for committing capital for decades.
When long-term yields rise even without a corresponding increase in central-bank policy rates, markets may be signaling that investors want to be paid considerably more to hold long-duration debt.
For equity traders, that distinction matters.
Higher long-term rates can raise corporate borrowing costs, increase mortgage rates and reduce the present value investors assign to future corporate earnings. The latter consideration is especially important for high-growth technology companies whose valuations depend heavily on profits expected many years into the future.
Oil Is Bringing Inflation Back Into the Conversation
One catalyst behind the bond selloff has been renewed strength in crude oil.
Energy prices have risen amid geopolitical instability surrounding the U.S.-Iran conflict, with Brent crude moving back above $90 per barrel.
Higher oil prices matter far beyond the energy sector.
Oil feeds into transportation, manufacturing, plastics, chemicals, agriculture and distribution costs throughout the economy. If energy prices remain elevated, investors may begin expecting inflation to remain higher for longer.
That creates an uncomfortable situation for central banks.
Economic growth can weaken while inflation remains persistent. In that environment, policymakers have less flexibility to aggressively reduce interest rates.
For traders, the interaction between oil prices and long-term Treasury yields may therefore become one of the most important macro relationships to monitor.
The Government Debt Problem Is Getting Harder to Ignore
The second force affecting long-term interest rates is fiscal policy.
The U.S. government debt burden is approaching $40 trillion, while large deficits require substantial new Treasury issuance. Investors must continually absorb that supply.
Normally, strong demand for Treasury securities can keep borrowing costs contained. But when investors are simultaneously worried about inflation, fiscal deficits and competing investment opportunities, they may demand higher yields before purchasing additional long-duration government debt.
This is sometimes described as a rising term premium.
Essentially, investors want more compensation for assuming the inflation and fiscal risks associated with holding a 20- or 30-year security.
The Treasury recently had to pay its highest interest rates since 2011 to sell 30-year bonds.
That tells us the market is not simply reacting to what the Federal Reserve may do at its next meeting. Investors are reconsidering the price of long-term capital itself.
Then Comes the AI Borrowing Boom
This is where the story becomes particularly interesting for technology traders.
The artificial intelligence buildout is extraordinarily capital intensive.
Companies are spending enormous sums on:
- AI data centers
- NVIDIA and other accelerator hardware
- Networking equipment
- Power generation and transmission
- Cloud infrastructure
- Cooling systems
- Real estate
- Fiber and connectivity
Not all of that spending will be financed from corporate cash flow.
Major technology companies are increasingly tapping global bond markets, including the market for long-duration corporate debt.
Barclays reportedly expects total investment-grade corporate issuance in 2026 to reach a record $1.9 trillion, compared with approximately $1.44 trillion last year.
That additional corporate supply is competing for some of the same investor capital needed to absorb government debt.
In other words, governments need money.
AI companies need money.
Infrastructure developers need money.
Utilities need money.
Data-center operators need money.
And investors are beginning to demand higher yields to provide it.
The AI Boom Could Be Creating Its Own Valuation Headwind
There is an interesting paradox developing.
The AI investment boom has been one of the principal reasons technology earnings expectations have risen so dramatically.
But financing that same investment boom could contribute to higher long-term interest rates.
Higher long-term rates, in turn, can reduce the valuations investors are willing to assign to technology companies.
This creates a feedback loop worth watching.
AI spending increases → corporate borrowing increases → bond supply increases → long-term yields rise → technology valuation multiples come under pressure.
That does not necessarily mean the AI trade is ending.
It means the market may become increasingly selective about which companies can generate enough earnings and cash flow to justify their valuations in a higher-rate environment.
Why the Nasdaq May Be Particularly Sensitive
The Nasdaq 100 recently fell approximately 1.5% during the latest increase in bond yields, compared with a smaller decline in the S&P 500.
That relative weakness makes economic sense.
Growth stocks are often described as long-duration equities.
Much of their perceived value comes from earnings investors expect far into the future. When the discount rate used to value those future earnings rises, their theoretical present value declines.
This is why traders should increasingly watch the relationship between:
- QQQ
- Nasdaq futures
- 10-year Treasury yields
- 30-year Treasury yields
- TLT
If long-term yields continue breaking higher while QQQ loses important technical support, we could see valuation compression even when individual technology companies continue reporting strong operating results.
Stocks to Watch: NVIDIA
NVIDIA (NVDA) remains at the center of AI infrastructure spending.
There are two competing forces traders should recognize.
On the positive side, enormous data-center investment supports demand for NVIDIA accelerators, networking products and AI infrastructure.
On the negative side, rapidly rising long-term interest rates can place pressure on the valuation multiples investors are willing to pay for high-growth technology companies.
For NVDA traders, this means strong company-specific news may increasingly have to overcome macro pressure from the bond market.
A particularly useful intraday tell will be whether NVDA can outperform QQQ when Treasury yields are rising. Relative strength during a hostile rate environment can indicate that institutional demand remains strong.
Microsoft, Meta, Amazon and Alphabet
Microsoft (MSFT), Meta Platforms (META), Amazon (AMZN) and Alphabet (GOOGL) are among the companies investing most aggressively in artificial intelligence infrastructure.
They also possess an advantage many smaller AI companies do not: enormous cash-generating businesses.
That distinction may become increasingly important.
If financing costs continue rising, investors may favor companies capable of funding AI expansion largely through operating cash flow rather than companies dependent upon constant access to capital markets.
Watch relative strength among the mega-cap technology names.
A market in which the strongest balance sheets outperform speculative AI companies would suggest that investors remain bullish on artificial intelligence while becoming more discriminating about financing risk.
Oracle and the Financing Question
Oracle (ORCL) deserves special attention because of its aggressive push into cloud and AI infrastructure.
Companies expanding data-center capacity rapidly may experience extraordinary revenue growth while simultaneously requiring enormous capital investment.
In a low-rate environment, markets tend to reward that expansion aggressively.
In a 5%-plus long-term rate environment, investors may begin asking a different question:
What return is the company earning on every dollar of AI infrastructure investment?
That question could become increasingly important across the entire AI ecosystem.
TLT Could Become One of the Most Important Charts on the Screen
Technology traders sometimes pay very little attention to Treasury ETFs.
That may be a mistake in the current environment.
The iShares 20+ Year Treasury Bond ETF (TLT) provides an easy visual representation of long-duration Treasury prices.
Remember that Treasury prices and yields move inversely.
When TLT falls sharply, long-term yields are generally rising.
For traders focused on QQQ, NVDA or other high-duration growth stocks, TLT can function almost like a macro confirmation indicator.
If QQQ is testing support while TLT is simultaneously breaking down, the bond market may be reinforcing the bearish equity signal.
If TLT stabilizes and yields retreat, technology stocks may suddenly receive an important macro tailwind.
Financial Stocks Could Benefit—But There Is a Catch
Higher long-term rates can initially appear positive for banks because a steeper yield curve may improve lending economics.
Stocks such as:
- JPMorgan Chase (JPM)
- Bank of America (BAC)
- Wells Fargo (WFC)
- Goldman Sachs (GS)
could therefore attract relative strength if investors expect better net interest margins.
But there is an important caveat.
If long-term yields are rising because investors fear fiscal instability or persistent inflation, the benefit to banks may eventually be overwhelmed by slower economic activity, credit deterioration or falling asset prices.
The key is determining why yields are rising.
Utilities and Data-Center Power Plays
The utility sector sits at the intersection of two powerful themes.
AI data centers require extraordinary amounts of electricity, creating potentially strong long-term demand for power generation.
At the same time, utilities are capital-intensive businesses that frequently depend upon debt financing.
Higher long-term interest rates therefore increase their cost of capital.
Traders following AI-related electricity names should watch whether the market continues rewarding future power demand or begins penalizing companies for financing costs.
The Utilities Select Sector SPDR Fund (XLU) can provide a useful sector-level gauge.
Homebuilders May Be Among the Most Direct Casualties
Higher long-term Treasury rates eventually translate into higher mortgage rates.
That creates obvious pressure on housing affordability.
Homebuilders such as:
- D.R. Horton (DHI)
- Lennar (LEN)
- PulteGroup (PHM)
- Toll Brothers (TOL)
should therefore remain on traders’ radar whenever long-term Treasury yields accelerate higher.
The housing sector may provide one of the clearest signals that higher borrowing costs are beginning to move from Wall Street into the real economy.
The Four Charts I Would Watch
For traders trying to simplify this complicated macro environment, I would keep four markets visible:
- 30-year Treasury yield — the clearest measure of pressure at the long end.
- TLT — a convenient proxy for long-duration Treasury prices.
- Brent crude oil — the inflation catalyst currently influencing the bond market.
- QQQ — the equity index most exposed to long-duration technology valuations.
The relationship among those four markets can tell us a tremendous amount about the trading environment.
A Potential Risk-Off Combination
The combination I would be most cautious about is:
- Oil breaking higher
- 30-year Treasury yields making new highs
- TLT making new lows
- QQQ losing technical support
- NVDA and the mega-cap technology leaders beginning to underperform
That would suggest the bond market is starting to impose meaningful pressure on equity valuations.
Under those circumstances, chasing technology stocks higher becomes considerably more dangerous.
A More Constructive Scenario
The opposite setup would be much more favorable for growth stocks.
If oil begins falling, inflation expectations moderate and Treasury yields retreat, the pressure on technology valuation multiples could ease quickly.
TLT stabilizing while QQQ begins showing relative strength would be an important signal.
In that environment, institutional investors could return aggressively to the strongest AI companies because the underlying secular growth story remains intact.
Trading Implications
The important takeaway is that traders should not treat rising bond yields as background noise.
The bond market is increasingly becoming part of the AI trade itself.
The enormous capital required to build artificial intelligence infrastructure is creating an unprecedented demand for financing at exactly the same time governments are issuing enormous quantities of debt.
That competition for capital may require investors to accept higher yields before absorbing all of the supply.
For short-term traders, this creates several practical opportunities.
- Watch QQQ versus Treasury yields. Rising yields combined with QQQ weakness can confirm a risk-off environment.
- Watch relative strength within the Magnificent Seven. The companies resisting macro pressure may become the leaders when yields stabilize.
- Monitor TLT intraday. A reversal in long-duration bonds can precede a change in technology-stock momentum.
- Watch oil. Persistent strength above the recent range can keep inflation expectations elevated.
- Compare AI infrastructure beneficiaries with highly leveraged AI plays. Balance-sheet quality may become increasingly important.
- Watch financials and homebuilders. They can provide confirmation that rising rates are spreading into other parts of the economy.
TraderInsight Bottom Line
The artificial intelligence story is no longer simply about who has the fastest chip or the most powerful model.
Increasingly, it is also about who can finance the infrastructure required to build the AI economy—and at what price.
Record government borrowing, higher energy prices, persistent inflation concerns and rapidly expanding corporate AI investment are all competing for the same pool of global capital.
That is why AI bond issuance and Treasury yields deserve a place on every technology trader’s radar.
The irony is that the AI boom may help push long-term interest rates higher even as AI companies continue producing extraordinary growth.
That does not destroy the AI thesis.
But it can change how the market values it.
And for traders, that distinction creates opportunity.
TraderInsight educational content is provided for informational and educational purposes only and is not investment advice. Trading involves substantial risk, and past performance does not guarantee future results.
Why Smart People Keep Repeating Mistakes
Understanding Intermittent Reinforcement and the Hidden Science of Lasting Habits
Mental Insight explores the psychology, neuroscience, and behavioral science behind consistent performance under pressure. These articles help explain why we think, learn, decide, and perform the way we do—and how understanding those processes can help us become more consistent in trading, work, relationships, and life.

Have you ever promised yourself you would never do something again, only to find yourself repeating it a few days or weeks later?
Perhaps you abandoned an exercise program because you did not see immediate results. Maybe you kept returning to an ineffective habit because every once in a while it seemed to work. Or perhaps you ignored your trading plan, took a larger risk than you intended, and the trade actually became profitable.
The opposite happens too. You may follow your plan carefully, execute exactly as intended, and still experience a disappointing outcome that makes you wonder whether the process really works.
These experiences are not necessarily signs of weak willpower. They reflect something much more fundamental about how human beings learn. Our brains pay close attention to what happens after we act, and the consequences of our behavior influence what we are likely to do again.
The difficulty is that in uncertain environments, consequences can be poor teachers. Sometimes bad decisions are rewarded. Sometimes good decisions are punished. Unless we learn to separate the quality of our behavior from the favorability of the immediate result, randomness can quietly begin shaping our future behavior.
This is why understanding intermittent reinforcement in trading is so important. Trading provides an almost perfect laboratory for seeing how unpredictable rewards can influence behavior, confidence, discipline, and eventually performance.
The Science of Intermittent Reinforcement
One of the most powerful principles in behavioral psychology is called intermittent reinforcement. With continuous reinforcement, a behavior is rewarded every time it occurs. With intermittent reinforcement, rewards arrive only some of the time and may be difficult to predict.
Decades of behavioral research have shown that behaviors reinforced unpredictably can become remarkably persistent. Slot machines are the familiar example. A player never knows which pull will produce a reward, and that uncertainty encourages continued play because the next attempt might be the successful one.
The same principle operates far beyond gambling. It can influence investing, sports, business, sales, relationships, social media, leadership, and any other environment in which actions and rewards are not perfectly connected.
The learning mechanism itself is not inherently bad. Persistence when rewards are uncertain can be extraordinarily useful. Many worthwhile activities require us to continue working even though any single attempt may fail. The problem arises when an ineffective or risky behavior occasionally produces a rewarding outcome.
That is where our brains can learn the wrong lesson.
Why Intermittent Reinforcement Matters for Performance
Imagine two professionals. The first prepares carefully, follows a thoughtful process, makes a sound decision, and still experiences an unfavorable outcome because of circumstances outside their control. The second ignores preparation, takes an unnecessary risk, and succeeds because events happened to move in their favor.
If both people evaluate themselves only by what happened, the first person may begin questioning good habits while the second becomes increasingly confident in poor ones.
Over time, the disciplined performer can actually become less disciplined, while the impulsive performer becomes more committed to behavior that was never sound in the first place.
The problem is not intelligence. The problem is that outcomes are imperfect teachers.
In uncertain environments, outcomes contain both signal and noise. The signal includes things such as preparation, attention, judgment, execution, emotional regulation, and the ability to adapt. The noise includes luck, timing, other people’s actions, changing circumstances, market conditions, and random variation.
Professional development depends on learning to separate those two things.
Intermittent Reinforcement in Trading
Few environments demonstrate this more clearly than the financial markets. Intermittent reinforcement in trading occurs because profitable and unprofitable outcomes do not line up perfectly with good and bad decisions.
Suppose a trader decides to move a stop rather than accept a planned loss. Price moves a little farther against the position, but eventually reverses. The trader exits with a profit.
Financially, the outcome feels good.
Psychologically, however, something potentially dangerous has happened. The trader’s brain has received a reward immediately after violating the trading plan.
The brain does not automatically record, “I abandoned my risk-management process and happened to benefit from a favorable reversal.”
It is much easier to learn, “Holding longer worked.”
The next time the same situation appears, moving the stop becomes a little easier. After several lucky escapes, it can start feeling almost reasonable. Eventually the trader encounters the trade that does not reverse, and the loss can be dramatically larger than anything the plan originally allowed.
This is one reason intermittent reinforcement in trading can make poor behaviors unusually difficult to eliminate. The behavior does not need to work consistently. It only needs to work occasionally enough to keep hope alive.
The Opposite Problem: When Good Behavior Gets Punished
There is another side of intermittent reinforcement that receives far less attention.
A trader may identify a valid setup, enter at the correct price, use appropriate position size, respect the stop, and execute the entire plan exactly as intended. The trade loses.
If the trader evaluates the experience entirely through profit and loss, disciplined execution has just been psychologically punished.
After several experiences like that, the trader may begin questioning the setup, changing rules prematurely, hesitating on the next opportunity, or searching for a completely different strategy.
The irony is that nothing may actually be wrong.
A strategy with positive expectancy does not have to produce a favorable result on every individual trade. In fact, it cannot. Variation is part of any probabilistic process.
This is why intermittent reinforcement in trading can distort learning in both directions. It can reward behaviors we should stop and temporarily punish behaviors we should continue.
The MPM Perspective
One of the central ideas in the Manz Performance Model is that every performance produces two outcomes.
The first is obvious. It is the visible result. You won or lost. The presentation succeeded or failed. The client said yes or no. The trade made money or it did not.
The second outcome is less visible, but potentially much more important. It is the lesson your brain takes away from the experience.
If that lesson is based only on the immediate outcome, development becomes hostage to luck. If the lesson is based on the quality of preparation, judgment, execution, and review, then even an unfavorable outcome can contribute to future capability.
This does not mean outcomes are unimportant. Results ultimately matter. A trading strategy that consistently loses money should not be protected simply because it was followed faithfully. A business strategy that repeatedly fails must eventually be reconsidered.
The distinction is between evaluating a process across an appropriate sample of evidence and abandoning it because of one emotionally powerful result.
Professional performers learn to ask not only, “Did this work?” but also, “Was this the kind of behavior I want to repeat?”
Using Intermittent Reinforcement on Your Side
The encouraging part of this story is that we are not simply passive recipients of reinforcement. We can become much more intentional about what we choose to reinforce.
For a trader, this means recognizing disciplined execution as a success even when a particular trade loses. If the setup met the plan, the risk was appropriate, the entry was valid, and the exit followed the rules, those behaviors deserve reinforcement.
Likewise, a profitable trade that violated the plan should not automatically be celebrated as a success. The profit is real, but so is the process violation.
This is where intermittent reinforcement in trading can actually be turned to your advantage. Instead of allowing individual outcomes to determine what gets strengthened, you intentionally reinforce the behaviors that are most likely to produce positive expectancy over hundreds or thousands of repetitions.
The same principle applies outside the markets. An athlete can reinforce correct technique before the result becomes visible. A leader can reinforce good communication even when one conversation goes poorly. A student can reinforce a disciplined study routine even when one test score disappoints. A business owner can reinforce a thoughtful decision process even when external circumstances temporarily work against it.
In each case, the performer is learning to reinforce what is repeatable rather than what was merely rewarding.
Putting It Into Practice
At the end of an important performance, begin by recording the outcome without immediately deciding whether the performance itself was good or bad. Then evaluate the behaviors that produced it.
Ask yourself whether you prepared appropriately, followed the intended process, stayed attentive, responded to meaningful new information, managed risk, and remained reasonably regulated under pressure.
If those behaviors were sound, acknowledge them even if the immediate result disappointed you. You are not pretending the loss or failure did not matter. You are making sure your brain does not accidentally learn that good execution should be abandoned simply because one outcome was unfavorable.
Conversely, when a questionable decision produces a favorable result, resist the temptation to use the outcome as proof that the behavior was wise.
Would I want to repeat this behavior one hundred more times?
That single question shifts attention away from the emotional power of today’s result and toward the long-term consequences of repeated behavior.
The Hidden Force
Your brain naturally repeats behaviors that are rewarded—even when the reward was created by luck rather than good judgment.
Intermittent reinforcement can therefore preserve behaviors that should disappear and weaken behaviors that deserve to continue. The goal is to become intentional about what your brain learns from each experience.
One Thing to Think About
Every performance teaches your brain something. The question is whether it is teaching the lesson you intended.
Think about a recent success or failure. What behavior did the outcome encourage you to repeat? Was that behavior actually responsible for what happened, or did luck, timing, or outside circumstances play an important role?
Performance Challenge
For the next seven days, divide a page in your journal into two simple categories: Outcome and Behavior to Reinforce.
First, record what happened as objectively as possible. Then write down the preparation, decision, habit, or action you believe deserves reinforcement.
Ask yourself: What behavior did today’s outcome naturally encourage me to repeat? Is that behavior aligned with the professional or person I want to become? If not, what behavior should I intentionally reinforce instead?
At the end of the week, look back across your entries rather than evaluating them individually. You may discover that some of your strongest performances did not produce your strongest outcomes—and some of your best outcomes did not come from your best performances.
That distinction is where a much more mature understanding of performance begins.
Julie’s Book Corner
Thinking, Fast and Slow by Daniel Kahneman
Daniel Kahneman’s work provides an accessible introduction to the ways people make judgments under uncertainty, rely on mental shortcuts, and sometimes draw surprisingly confident conclusions from limited evidence.
While the book is not specifically about intermittent reinforcement, it provides an excellent foundation for understanding why the conclusions we draw from success and failure are not always as accurate as they feel.
Julie’s Toolbox
One of the simplest tools for changing reinforcement patterns is a performance journal. It does not need to be elaborate. In fact, a simple notebook may be more useful than an overly complicated tracking system if you are more likely to use it consistently.
The goal is to create enough distance between the outcome and your interpretation of it that you can evaluate the performance more accurately. Record what happened, the quality of your process, important outside influences, and the behavior you want to strengthen next time.
Over time, the journal can help you recognize when good fortune is disguising poor execution, when an unfavorable result is weakening confidence in a sound process, and when repeated evidence genuinely indicates that something needs to change.
Amazon Performance Journal Link
As an Amazon Associate, we may earn from qualifying purchases. These recommendations include products we genuinely use, value, or believe may benefit our readers. Thank you for supporting our work.
Final Thought
One of the great paradoxes of human performance is that our brains naturally learn from rewards, but rewards do not always reflect wisdom.
Sometimes success rewards poor judgment. Sometimes failure temporarily punishes excellent execution. The performer who learns to distinguish between those two things gains an enormous developmental advantage.
Over time, that person becomes less dependent on favorable outcomes for confidence and more committed to the behaviors that create lasting excellence.
In uncertain environments, the goal is not simply to reinforce winning.
It is to reinforce the behaviors that make winning more likely across hundreds—and eventually thousands—of repetitions.